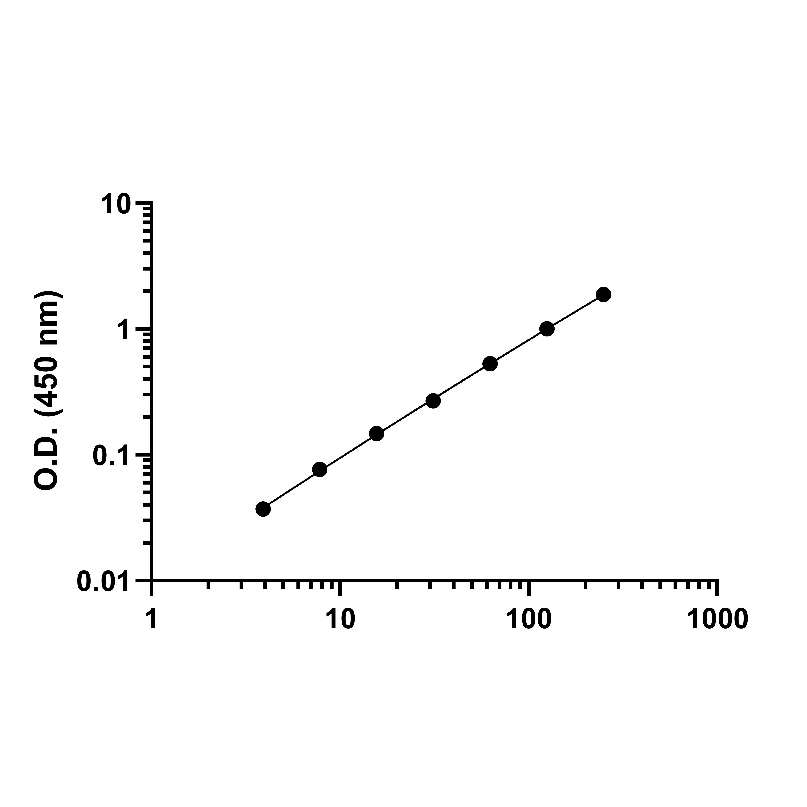
Standard curve
Example of human IL-5 standard curve in Assay Diluent #1.
Human IL-5 OneStep ELISA Kit
Human IL-5 OneStep ELISA Kit
Price:
Regular price
$500 USD
Regular price
Sale price
$500 USD
Unit price
per
For shipping services or bulk orders, you may request a quotation.
Secure checkout with

View full details
Product Details
Product Details
Product Specification
| Antigen | IL-5 |
| Immunogen | Recombinant Protein |
| Antibody Type | Recombinant mAb |
| Reactivity | Hu |
| Purification | Protein A |
| Stability & Storage | 2 to 8 °C as supplied. |
Kit
| Precision |
Intra-assay: 4.7%; Inter-assay: 6.4% |
| Sample type | Cell culture supernatant, Serum, Plasma |
| Assay type | Sandwich (quantitative) |
| Sensitivity | 1.1 pg/ml |
| Range | 3.9 pg/ml - 250 pg/ml |
| Recovery | Cell culture supernatant 85% Serum 102% Plasma 97% |
| Assay time | 60 minutes |
| Species reactivity | Human |
| CROSS REACTIVITY | / |
| INTERFERENCE | / |
| NIBSC convert | The dose response curve of the International Standard (90/586) parallels the OneStep standard curve. To convert sample values obtained with the kit to approximate NIBSC (90/586) units, use the following equation: NIBSC (90/586) approximate value (IU/mL) = 0.01 x OneStep Human IL-5 value (pg/mL). |
Background
IL-5 protein, also known as Interleukin-5, is a protein molecule produced by the immune system and belongs to the category of cytokines. It is primarily expressed by T lymphocytes and other immune cells, such as NK cells. IL-5 plays a crucial role in regulating and mobilizing the body's immune response. IL-5 protein is critical for the generation, proliferation, and activation of eosinophils and basophils. These cells play significant roles in allergic diseases (such as allergic asthma and rhinitis) and certain parasitic infections. Given these characteristics of IL-5 protein, it has potential applications in in vitro diagnostics. By measuring the levels of IL-5 protein in bodily fluids, it can assist in diagnosing diseases associated with eosinophils or basophils, such as eosinophilic asthma and allergic rhinitis. These diseases are often linked to excessive expression or dysfunctional IL-5 protein. Furthermore, the level of IL-5 protein can reflect the state of the immune system.
Picture
Picture
ELISA
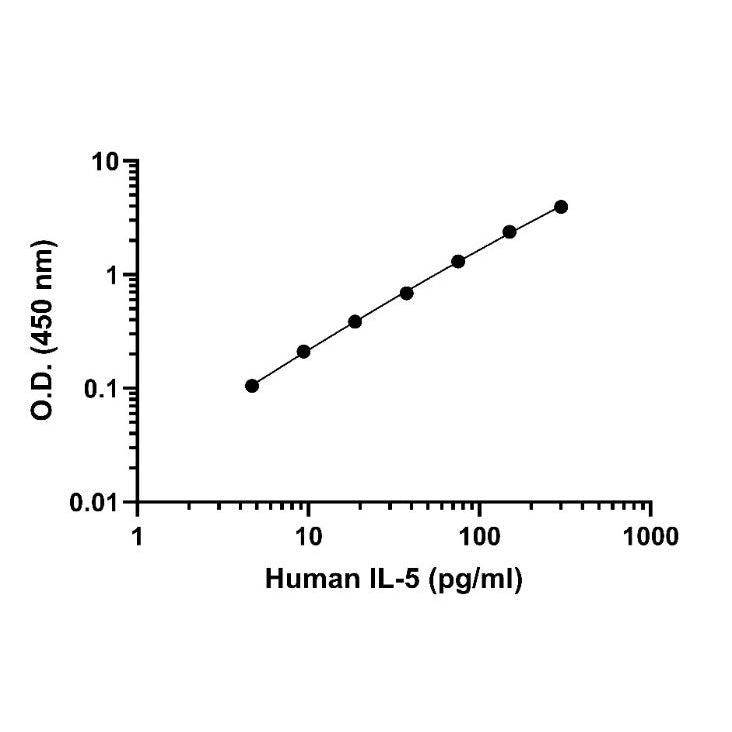
Standard curve
Example of human IL-5 standard curve in Assay Diluent #1S5.
Linearity
The concentrations of IL-5 were measured and interpolated from the target standard curves and corrected for sample dilution.
#1 sample is undiluted samples are as follows: human PBMC cells stimulated with 10ug/ml PHA for 5days (50%). The interpolated dilution factor corrected values are plotted. The mean target concentration was determined to be 167 pg/mL in stimulated human PBMC supernatant.
#2 sample is undiluted samples are as follows: human PBMC cells culture for 5days (100%). The interpolated dilution factor corrected values are plotted. The mean target concentration was determined to be 5 pg/mL in unstimulated human PBMC supernatant.
Leading Competitor comparison
Protocol Diagram
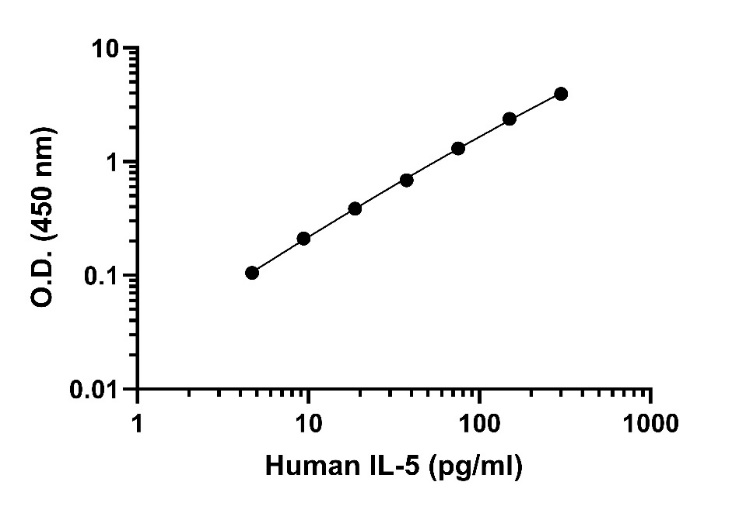
Standard curve
Example of human IL-5 standard curve in Assay Diluent #1.
Example of human IL-5 standard curve in Assay Diluent #1.