Standard curve
Example of Mouse IgM standard curve in Assay Diluent #1.
| Antigen | IgM |
| Immunogen | Recombinant Protein |
| Antibody Type | Recombinant mAb |
| Reactivity | Ms |
| Purification | Protein A |
| Stability & Storage | 2 to 8 °C as supplied. |
| Precision |
Intra-assay: 3.2%; Inter-assay: 6.8% |
| Sample type | Serum, Plasma |
| Assay type | Sandwich (quantitative) |
| Sensitivity | 0.298 ng/ml |
| Range | 1.25 ng/mL - 80 ng/mL |
| Recovery | Serum 92% Plasma 102% |
| Assay time | 60 minutes |
| Species reactivity | Mouse |
| CROSS REACTIVITY | / |
| INTERFERENCE | / |
| NIBSC convert | / |
Mouse immunoglobulin M (IgM) is a crucial component of the humoral immune system and is the first antibody produced by B-cells in response to an antigenic challenge. It exists in two forms: a pentameric (19S) form found in serum and a monomeric (8S) form on the surface of lymphocytes. The IgM pentamer, which is the predominant form in circulation, consists of five monomeric units and has a molecular weight of approximately 900 kDa, while the hexameric form has a molecular weight of about 1050 kDa. Each monomer of IgM is composed of two heavy chains and two light chains, with the heavy chain having four constant domains (CH1-CH4) and the light chain having one constant domain (CL). The CH4 domain facilitates oligomerization, leading to the formation of penta- or hexamers, and these oligomers are covalently linked via disulfide bonds, resembling a snowflake structure. A joining (J) chain, a 15 kDa polypeptide, is essential for the secretion of IgM into mucosal areas.
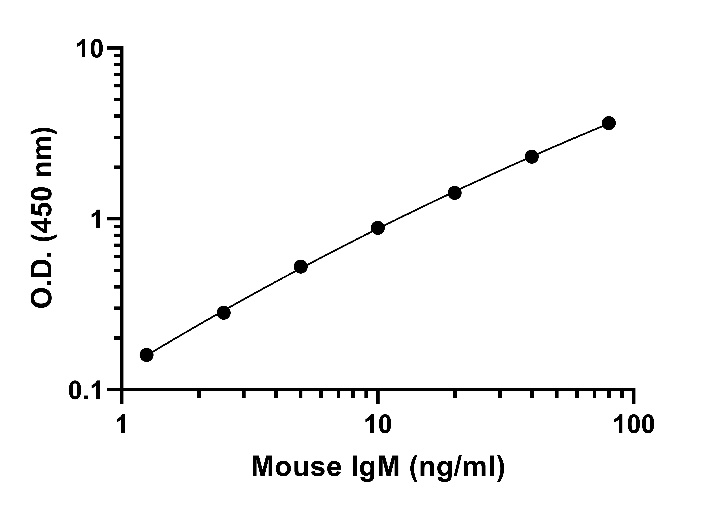
Standard curve
Example of Mouse IgM standard curve in Assay Diluent #1.
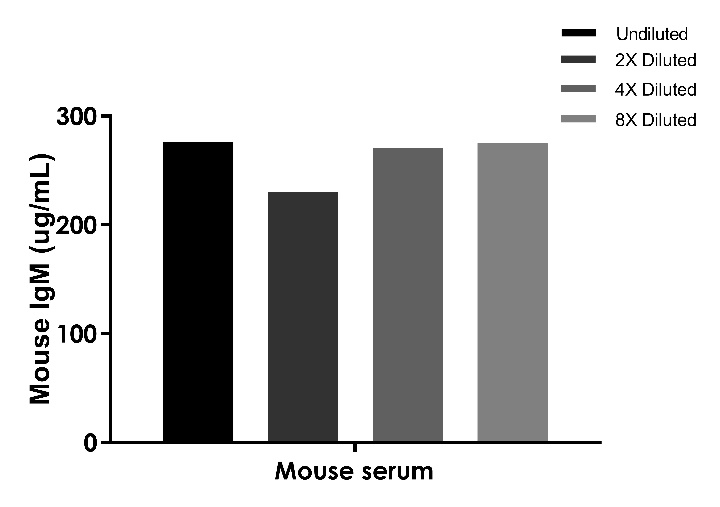
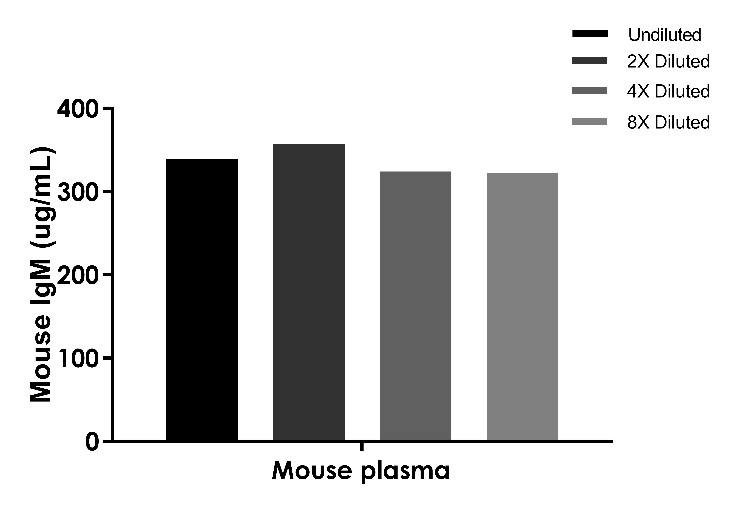
Linearity
The concentrations of Mouse IgM were measured and interpolated from the target standard curves and corrected for sample dilution.
#1 sample is undiluted samples are as follows: Mouse serum was 4×10^3 fold dilution. The interpolated dilution factor corrected values are plotted. The mean target concentration was determined to be 262.88 ug/mL in Mouse serum.
#2 sample is undiluted samples are as follows: Mouse plasma was 4×10^3 fold dilution. The interpolated dilution factor corrected values are plotted. The mean target concentration was determined to be 335.85 ug/mL in Mouse plasma.
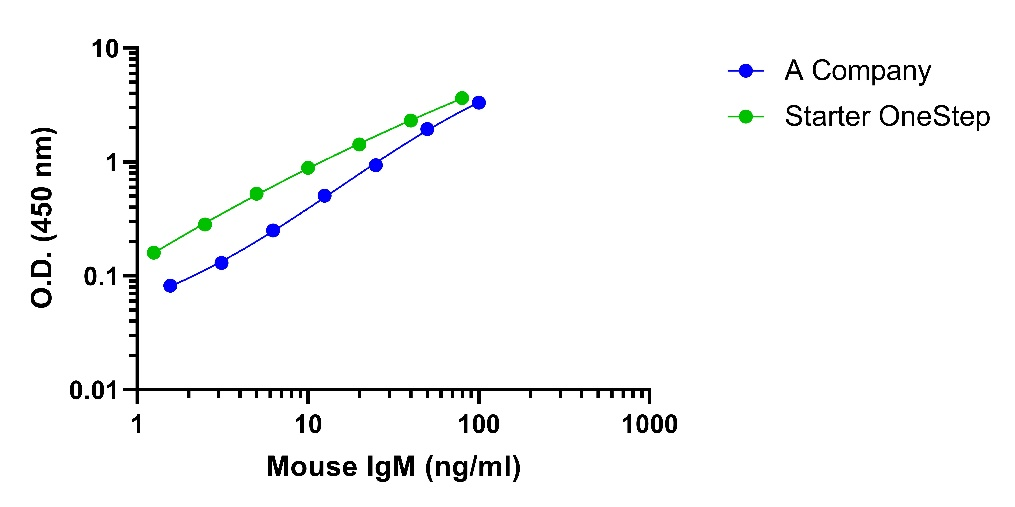
Leading Competitor comparison
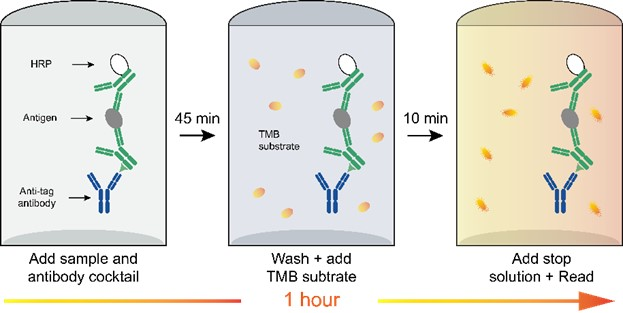
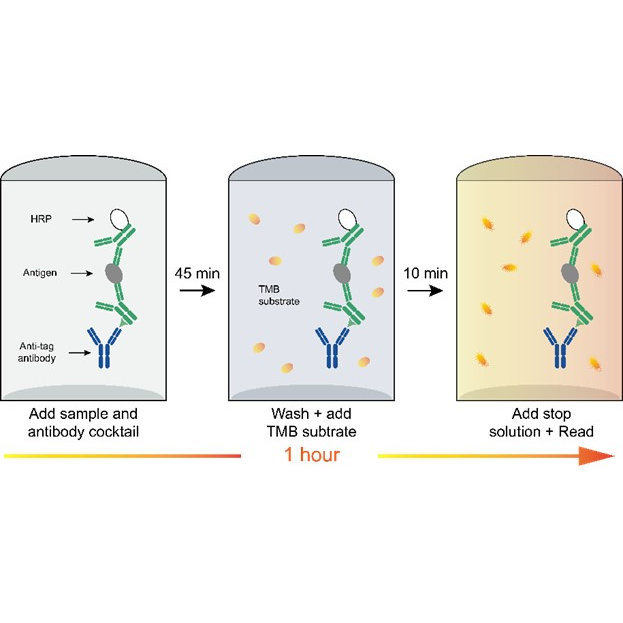
Protocol Diagram