UniOne® TR-FRET Human TNF-α TNFR1 Binding Kit
UniOne® TR-FRET Human TNF-α TNFR1 Binding Kit
Product Details
Product Details
Product Specification
| Host | Human |
| Stability & Storage | -80℃ |
Background
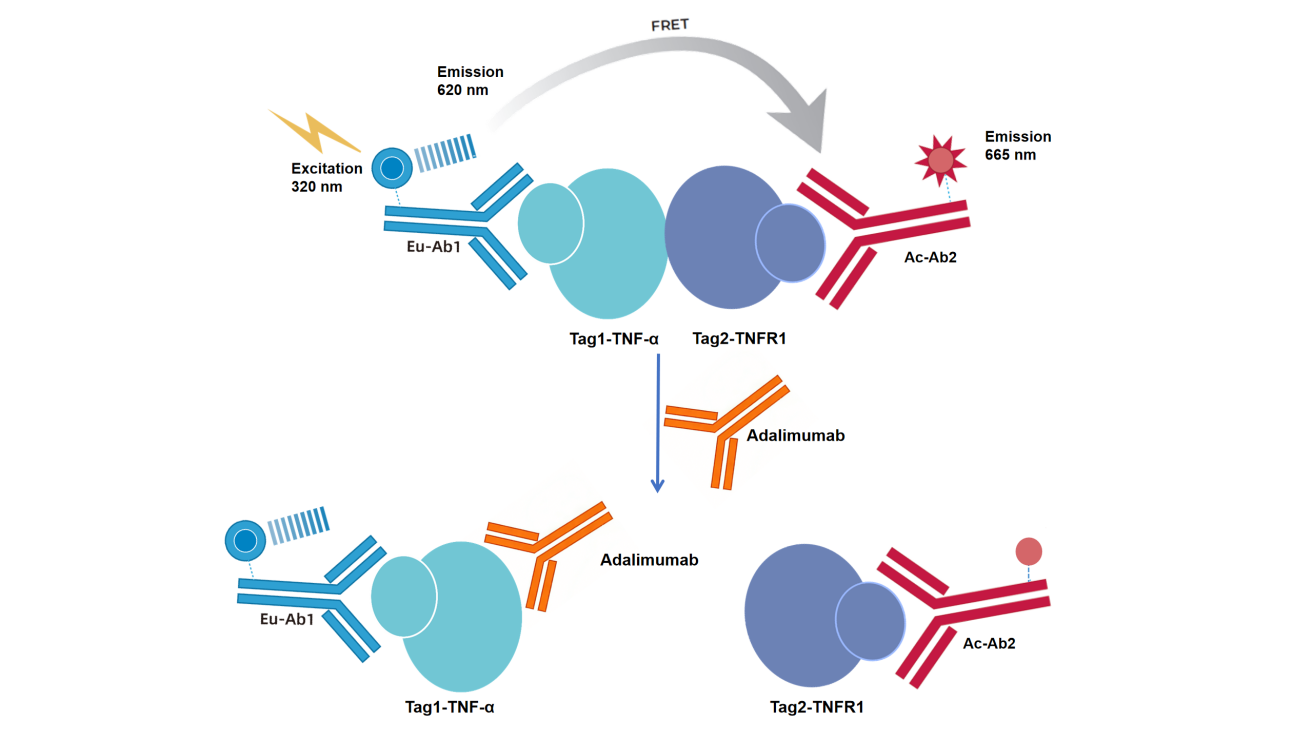
The kit utilizes homogeneous time-resolved fluorescence technology (TR-FRET) to measure the interaction between TNF-α and TNFR1. This method enables simple and rapid high-throughput screening of inhibitors and antibody blockers.
As shown in the figure, the interaction between TNF-α and TNFR1 is detected using a Eu-labeled anti-Tag1 antibody (TR-FRET donor) and an Ac-labeled anti-Tag2 antibody (TR-FRET acceptor). The binding of TNF-α to TNFR1 brings the donor and acceptor antibodies into close proximity, allowing fluorescence resonance energy transfer (FRET) from the donor to the acceptor, resulting in a specific emission signal at 665 nm. The positive control drug Adalimumab blocks the binding of TNF-α to TNFR1, preventing FRET signal generation. The stronger the inhibitory effect of the screened drug on the TNF-α/TNFR1 interaction, the lower the signal. This specific signal is proportional to the extent of TNF-α/TNFR1 interaction. The homogeneous assay is simple to perform and requires no washing steps.
Components
Component |
Concentration |
100T |
500T |
2500T |
10000T |
Storage Temperature |
Tag1-TNF-α protein |
100 × |
5μL |
20μL |
100μL |
400μL |
-80℃ |
Tag2- TNFR1 protein |
100 × |
5μL |
20μL |
100μL |
400μL |
-80℃ |
Eu-anti-Tag1 |
50 × |
10μL |
50μL |
250μL |
1000μL |
-80℃ |
Ac-anti-Tag2 |
12.5 × |
40μL |
200μL |
1mL |
4mL |
-80℃ |
Detection buffer |
10 × |
400μL |
2mL |
10mL |
40mL |
-80℃ |
Note: Aliquot immediately after initial thawing and store at recommended temperatures. Avoid storage after dilution and repeated freeze-thaw cycles.
Protocol
Here is the English translation while preserving the original formatting:```html
1. Reagent Preparation
1.1 Thaw all reagents at room temperature before use (equilibrate for at least 30 min). The reaction system in 384-well plates is 20μL (reagent volumes are shown in the table below). Calculate the required volume before preparation. The following preparation is for reference only, using 500 reactions as an example.
Table 1. Reagent Preparation
Reagent Name |
Preparation |
Volume per Well (μL) |
Detection buffer |
Add 2mL of 10× Detection buffer to 18 mL deionized water, dilute to 1×, and mix well. |
- |
Tag1-TNF-α protein |
Add 20μL of 100× Tag1-TNFα protein stock to 1.98 mL 1× Detection buffer, dilute to 1×, and mix well. |
4 |
Tag2-TNFR1 protein |
Add 20μL of 100× Tag2-TNFR1 protein stock to 1.98 mL 1× Detection buffer, dilute to 1×, and mix well. |
4 |
Detection Mix |
Add 50μL of 50× Eu-anti-Tag1 stock to 2.45 mL 1× Detection buffer, dilute to 2.5 mL, and mix well; Add 200μL of 12.5× Ac-anti-Tag2 stock to 2.30 mL 1× Detection buffer, dilute to 2.5 mL, and mix well; Mix the two solutions at 1:1 ratio to prepare the Detection Mix. |
10 |
1.2 Sample serial dilution
Take Adalimumab as an example. The diluent is 1× Detection buffer. To minimize matrix effects, it is recommended to use a solution with the same matrix as the sample. Adjust the dilution according to the actual sample concentration.
Table 2. Adalimumab serial dilution (adjust as needed)
Adalimumab Final Conc. (nM) |
Adalimumab Prep. Conc. (nM) |
Preparation Method |
|
① |
1000.00 |
10000.00 |
1μL 375μM stock + 36.5μL 1× Detection buffer |
② |
400.000 |
4000.000 |
10μL ① +15μL 1× Detection buffer |
③ |
160.000 |
1600.000 |
10μL ② +15μL 1× Detection buffer |
④ |
64.000 |
640.000 |
10μL ③ +15μL 1× Detection buffer |
⑤ |
25.600 |
256.000 |
10μL ④ +15μL 1× Detection buffer |
⑥ |
10.240 |
102.400 |
10μL ⑤ +15μL 1× Detection buffer |
⑦ |
4.096 |
40.960 |
10μL ⑥ +15μL 1× Detection buffer |
⑧ |
1.638 |
16.384 |
10μL ⑦ +15μL 1× Detection buffer |
⑨ |
0.655 |
6.554 |
10μL ⑧ +15μL 1× Detection buffer |
⑩ |
0.262 |
2.621 |
10μL ⑨ +15μL 1× Detection buffer |
⑪ |
0.105 |
1.049 |
10μL ⑩ +15μL 1× Detection buffer |
Blank |
0 |
0 |
15μL 1× Detection buffer |
2. Sample Loading and Controls
2.1 Sample wells: Add 2μL of sample (serial dilution), 4μL Tag1-TNF-α protein working solution, 4μL Tag2-TNFR1 protein working solution, and 10μL Detection Mix sequentially to 384-well plates.
2.2 Max signal control: Add 2μL Detection buffer, 4μL Tag1-TNF-α protein working solution, 4μL Tag2-TNFR1 protein working solution, and 10μL Detection Mix sequentially to 384-well plates.
2.3 Negative control (NC): Add 10μL Detection buffer and 10μL Detection Mix sequentially to 384-well plates.
After loading all samples, centrifuge, seal with plate seal, and incubate at room temperature for 2 hours.
|
Sample |
Max Signal Control |
Negative Control (NC) |
Step 1 |
2μL sample |
2μL 1×Detection buffer |
10μL 1×Detection buffer |
4μL Tag1-TNF-α protein working solution | |||
Incubate at RT for 10 min | |||
Step 2 |
4μL Tag2-TNFR1 protein working solution |
||
10μL Detection Mix | |||
Seal plate and incubate at RT for 2h | |||
3. Detection
Read plates using a TR-FRET compatible microplate reader. Excitation wavelength: 320/340 nm; emission wavelengths: 620 nm and 665 nm.
[Data Analysis]
1) Calculate signal ratio: Divide 665 nm fluorescence signal by 620 nm fluorescence signal and multiply by 10000.
Ratio = (665/620) ×10000
2) Calculate Net signal based on ratio:
Net signal = (Std-NC)/NC×100
3) Calculate CV (%):
CV (%) = Standard Deviation/Mean Ratio × 100%
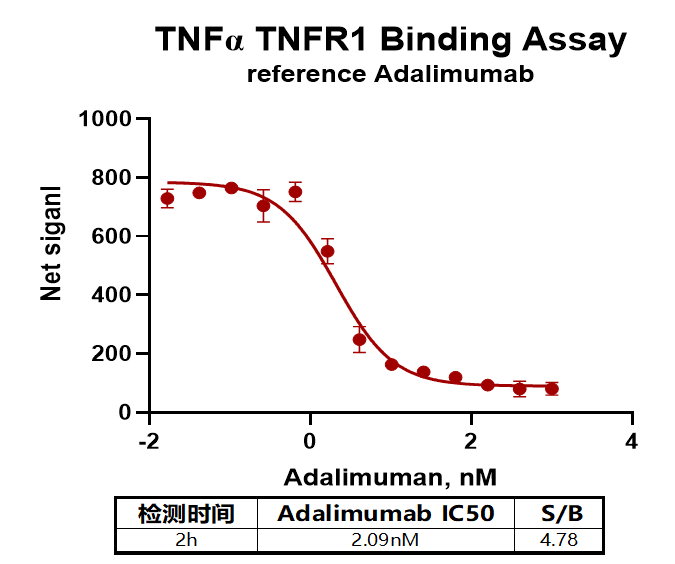
[Example Data]
The following data is for reference only and may vary depending on the plate reader used.
Note: Recommended microplate (384-well plate, white, shallow well)
```