Standard curve
Example of Human IL-2 standard curve in Assay Diluent G1.
UniPlex Human CAR-TCRS Cytokine Multiplex OneStep ELISA Kit (IL-2, IL-6, TNF-a, IFN-γ)
UniPlex Human CAR-TCRS Cytokine Multiplex OneStep ELISA Kit (IL-2, IL-6, TNF-a, IFN-γ)
Price:
Regular price
$1,335 USD
Regular price
Sale price
$1,335 USD
Unit price
per
For shipping services or bulk orders, you may request a quotation.
Secure checkout with

View full details
Product Details
Product Details
Product Specification
| Immunogen | Recombinant Protein |
| Antibody Type | Recombinant mAb |
| Reactivity | Hu |
| Purification | Protein A |
| Stability & Storage | 12 months from date of receipt / reconstitution, 2 to 8°C as supplied. |
Kit
| Sample type | Cell culture supernatant; Serum; Plasma |
| Assay type | Sandwich (quantitative) |
| Range | Human IL-2: 7.81 pg/mL – 500 pg/mL Human IL-6: 0.78 pg/mL – 50 pg/mL Human TNF-α: 7.81 pg/mL – 500 pg/mL Human IFN-γ: 3.13 pg/mL – 200 pg/mL |
| Recovery | Human IFN-γ |
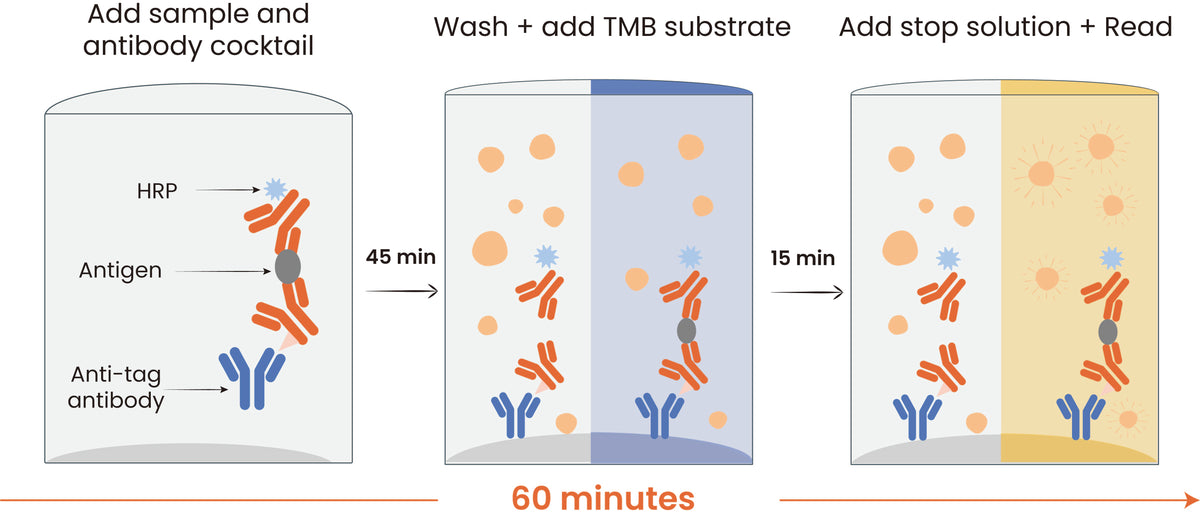
| Assay time | 60 minutes |
| Species reactivity | Hu |
Background
Human IL-2, IL-6, TNF-α, and IFN-γ are key cytokines that orchestrate diverse immune functions, ranging from T cell regulation to inflammation and antimicrobial defense. IL-2, produced mainly by activated T cells, drives T cell proliferation and supports regulatory T cell survival, making it critical for immune homeostasis and cancer immunotherapy. IL-6 is a pleiotropic cytokine secreted by immune and stromal cells; it induces acute-phase responses and B cell differentiation but can also fuel chronic inflammation and cytokine storms when dysregulated. TNF-α, a major pro-inflammatory cytokine from macrophages and T cells, mediates fever, apoptosis, and cachexia, and is a primary therapeutic target in autoimmune diseases such as rheumatoid arthritis. IFN-γ, the sole type II interferon, is produced by natural killer cells and T lymphocytes; it activates macrophages, enhances antigen presentation, and directs cell-mediated immunity against intracellular pathogens. Together, these four cytokines form an interconnected network that balances immune activation, inflammation, and host defense.
Picture
Picture
ELISA
Standard curve
Example of Human IL-6 standard curve in Assay Diluent G1.
Standard curve
Example of Human TNF-α standard curve in Assay Diluent G1.
Standard curve
Example of Human IFN-γ standard curve in Assay Diluent G1.
Linearity
The concentrations of Human IL-2 were measured and interpolated from the target standard curves and corrected for sample dilution.
The sample is undiluted samples are as follows: Jurkat T cells stimulated with 10 ng/ml PMA and 150 ng/ml A23187 for 24 h (10%). The interpolated dilution factor corrected values are plotted. The mean target concentration was determined to be 3160.45 pg/mL in stimulated Jurkat supernatant.
Linearity
The concentrations of Human IL-6 were measured and interpolated from the target standard curves and corrected for sample dilution.
The sample is undiluted samples are as follows: human PBMC cells stimulated with 10ug/ml PHA for 5 days (0.16%). The interpolated dilution factor corrected values are plotted. The mean target concentration was determined to be 38252.05 pg/mL in stimulated human PBMC supernatant.
Linearity
The concentrations of Human TNF-α were measured and interpolated from the target standard curves and corrected for sample dilution.
The sample is undiluted samples are as follows: human PBMC cells stimulated with 10ug/ml PHA for 5 days (10%). The interpolated dilution factor corrected values are plotted. The mean target concentration was determined to be 6362.08 pg/mL in stimulated human PBMC supernatant.
Linearity
The concentrations of Human IFN-γ were measured and interpolated from the target standard curves and corrected for sample dilution.
The sample is undiluted samples are as follows: human PBMC cells stimulated with 10ug/ml PHA for 5 days (2.5%). The interpolated dilution factor corrected values are plotted. The mean target concentration was determined to be 10054.28 pg/mL in stimulated human PBMC supernatant.
Consistency rate
The concordance rate between biological sample concentrations calculated from standard curves based on the kit-recommended high and low concentrations versus those calculated from the full standard curve.
Protocol Diagram