Standard Curve
Example of Rat α-1 acid glycoprotein standard curve in Assay Diluent W1. Plotted are the background-subtracted data.
This standard curve is provided for demonstration only.
Rat alpha-1 acid glycoprotein OneStep ELISA Kit
Rat alpha-1 acid glycoprotein OneStep ELISA Kit
Price:
Regular price
$500 USD
Regular price
Sale price
$500 USD
Unit price
per
For shipping services or bulk orders, you may request a quotation.
Secure checkout with

View full details
Product Details
Product Details
Product Specification
| Antigen | Alpha-1 acid glycoprotein |
| Immunogen | Recombinant Protein |
| Antibody Type | Recombinant mAb |
| Reactivity | Rt |
| Purification | Protein A |
| Stability & Storage | 12 months from date of receipt / reconstitution, 2 to 8°C as supplied. |
Kit
| Precision | Intra-assay: 3.0% Inter-assay: 4.5% |
| Sample type | Cell culture supernatant; Serum; Plasma |
| Assay type | Sandwich (quantitative) |
| Sensitivity | 0.581 pg/mL |
| Range | 6.25 pg/mL – 400 pg/mL |
| Recovery | Cell culture supernatant: 105% SD Rat Serum: 92% SD Rat Heparin Plasma: 107% SD Rat EDTA Plasma: 103% SD Rat Citrate Plasma: 88.4% SHR Rat EDTA Plasma: 106.2% LEWIS Rat Serum: 98.8 LEWIS Rat EDTA Plasma: 91.2% |
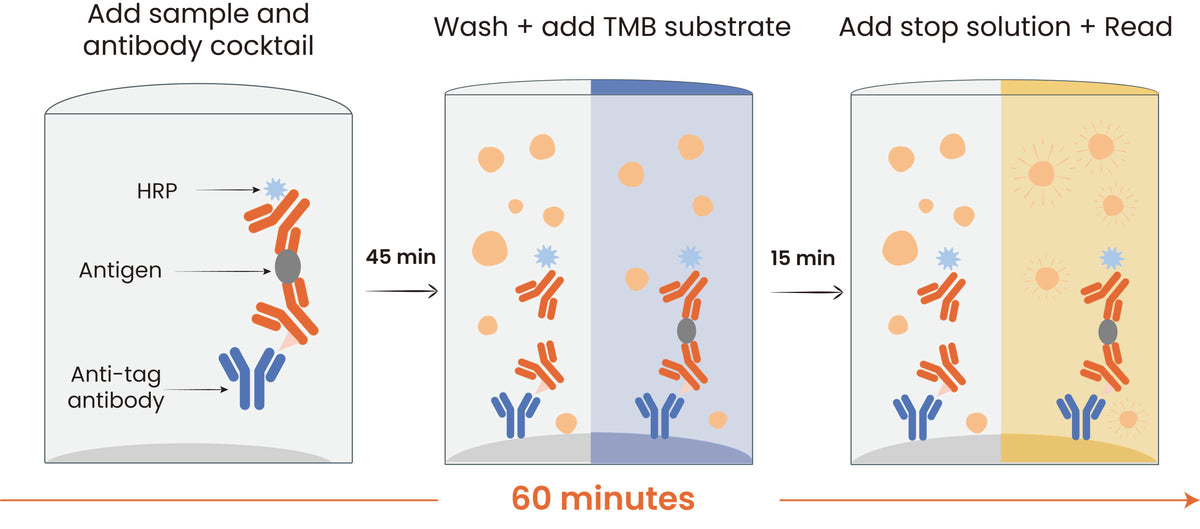
| Assay time | 60 minutes |
Background
Rat alpha-1-acid glycoprotein (AGP), also known as orosomucoid, is a major acute-phase protein primarily synthesized in the liver and secreted into the bloodstream. It functions as a transport protein, binding various ligands including basic drugs within its beta-barrel domain, and plays a significant role in modulating immune system activity during the acute-phase response. The mature protein is composed of approximately 187 amino acids, and its extensive glycosylation, which accounts for about 45% of its total molecular mass, gives it a total weight of around 41-43 kDa. This glycosylation is highly complex, featuring mixtures of sialylated, biantennary, and triantennary carbohydrate chains, some of which contain N, O-acetylneuraminic acids. The protein's expression is strongly induced during inflammation, with levels increasing 5- to 50-fold upon stimuli like infection or tissue injury, a process regulated by glucocorticoids and inflammatory cytokines such as IL-1 and IL-6. Beyond its transport functions, AGP has demonstrated immunomodulatory properties, including inhibiting platelet aggregation, lymphocyte transformation, and influencing cytokine production. Given its significant elevation during inflammation and roles in drug binding and immune regulation, rat AGP is a valuable biomarker and a crucial tool for studying the acute-phase response and inflammatory diseases in preclinical models.
Picture
Picture
ELISA
Dilution Linearity
The concentrations of Rat α-1 acid glycoprotein were measured and interpolated from the target standard curves and corrected for sample dilution.
The leftmost bar in the graph shows biological samples diluted in Assay Diluent to 0.002% concentration. "undiluted" was defined as 0.002% biological sample. The subsequent bars represent two-fold serial dilutions of this reference. The mean target concentration was determined to be 14.7 μg/mL in Rat SD serum.
Dilution Linearity
The concentrations of Rat α-1 acid glycoprotein were measured and interpolated from the target standard curves and corrected for sample dilution.
The leftmost bar in the graph shows biological samples diluted in Assay Diluent to 0.001% concentration. "undiluted" was defined as 0.001% biological sample. The subsequent bars represent two-fold serial dilutions of this reference. The mean target concentration was determined to be 55.3 μg/mL in Rat SD citrate plasma. The mean target concentration was determined to be 45.7 μg/mL in Rat SD heparin plasma. The mean target concentration was determined to be 29.7 μg/mL in Rat SD EDTA plasma.
Dilution Linearity
The concentrations of Rat α-1 acid glycoprotein were measured and interpolated from the target standard curves and corrected for sample dilution.
The leftmost bar in the graph shows biological samples diluted in Assay Diluent to 0.001% concentration. "undiluted" was defined as 0.001% biological sample. The subsequent bars represent two-fold serial dilutions of this reference. The mean target concentration was determined to be 22.0 μg/mL in Rat LEWIS serum.
Dilution Linearity
The concentrations of Rat α-1 acid glycoprotein were measured and interpolated from the target standard curves and corrected for sample dilution.
The leftmost bar in the graph shows biological samples diluted in Assay Diluent to 0.0005% concentration. "undiluted" was defined as 0.0005% biological sample. The subsequent bars represent two-fold serial dilutions of this reference. The mean target concentration was determined to be 105.3 μg/mL in Rat SHR EDTA plasma. The mean target concentration was determined to be 62.3 μg/mL in Rat LEWIS EDTA plasma.
Spike Recovery
The recovery of Rat α-1 acid glycoprotein was evaluated in activated samples spiked with concentrations spanning the entire assay range.
Spike Recovery
Recovery of Rat α-1 acid glycoprotein was assessed by spiking a 200 pg/mL standard into 0.001% serum (or 0.001% EDTA plasma, or 0.0005% heparin plasma, or 0.0005% citrate plasma). Serial dilutions of the spiked sample were prepared, and the percent recovery was calculated for each dilution relative to the expected concentration.
Spike Recovery
Recovery of Rat α-1 acid glycoprotein was assessed by spiking a 200 pg/mL standard into 0.001% serum (LEWIS).
Recovery of Rat α-1 acid glycoprotein was assessed by spiking a 200 pg/mL standard into 0.0005% EDTA plasma (SHR). Recovery of Rat α-1 acid glycoprotein was assessed by spiking a 200 pg/mL standard into 0.0005% EDTA plasma (LEWIS). Serial dilutions of the spiked sample were prepared, and the percent recovery was calculated for each dilution relative to the expected concentration.
Cross-reactivity
The heatmap displays OD450 ratios for serum samples from multiple species. Color intensity is proportional to the O.D.450 ratio (test species / reference species). Darker colors indicate higher cross-reactivity.
Determination of Minimum Detectable Dose (MDD)
The MDD was determined using three independent lots of assay components. For each lot, 19 replicate measurements of the diluent (zero calibrator) were performed. The mean (AVERAGE) and standard deviation (STDEV) of the 19 replicates were calculated. The MDD for each lot was then calculated according to the following formula:
MDD = 2 × STDEV + AVERAGE
Intra-Assay Precision (Precision within an assay)
Three samples of known concentration were tested fifteen times on one plate to assess intra-assay precision.
Inter-Assay Precision (Precision between assays)
Three samples of known concentration were tested in separate assays to assess inter-assay precision. Assays were performed with at least three lots of components.
HOOK Effect Threshold
The upper limit of the HOOK effect was established at 100× the highest calibrator concentration (equivalent to a 2-log10 increase). No HOOK effect was observed below this threshold, confirming that samples within this concentration range yield reliable quantitative results without signal depression.
Leading Competitor comparison
Protocol Diagram