Standard curve
Example of Rat IgE standard curve in Assay Diluent E1.
Rat IgE Serum & Plasma OneStep ELISA Kit
Rat IgE Serum & Plasma OneStep ELISA Kit
Price:
Regular price
$500 USD
Regular price
Sale price
$500 USD
Unit price
per
For shipping services or bulk orders, you may request a quotation.
Secure checkout with

View full details
Product Details
Product Details
Product Specification
| Antigen | IgE |
| Immunogen | Recombinant Protein |
| Antibody Type | Recombinant mAb |
| Reactivity | Rt |
| Purification | Protein A |
| Stability & Storage | 12 months from date of receipt / reconstitution, 2 to 8°C as supplied. |
Kit
| Precision | Intra-assay: 1.9% Inter-assay: 3.1% |
| Sample type | Serum; Plasma |
| Assay type | Sandwich (quantitative) |
| Sensitivity | 0.05 ng/mL |
| Range | 0.16 ng/mL – 10 ng/mL |
| Recovery | Rat SD Serum: 100% Rat SD EDTA Plasma: 98% Rat SD Heparin Plasma: 102% Rat SD Citrate Plasma: 103% Rat SHR Serum: 99% Rat SHR EDTA Plasma: 95% Rat Lewis Serum: 97% Rat Lewis EDTA Plasma: 93% |
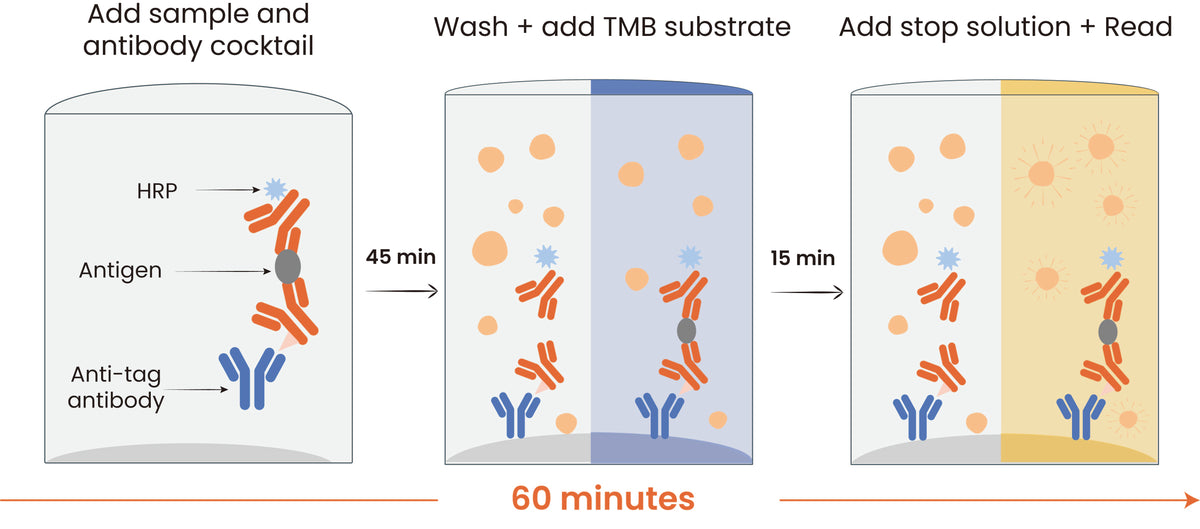
| Assay time | 60 minutes |
Background
Immunoglobulin E (IgE) is a type of antibody (or immunoglobulin "isotype") that has been found only in mammals. IgE is synthesised by plasma cells. Monomers of IgE consist of two heavy chains (ε chain) and two light chains, with the ε chain containing four Ig-like constant domains (Cε1–Cε4). IgE is thought to be an important part of the immune response against infection by certain parasitic worms, including Schistosoma mansoni, Trichinella spiralis, and Fasciola hepatica. IgE is also utilized during immune defense against certain protozoan parasites such as Plasmodium falciparum. IgE may have evolved as a defense to protect against venoms. IgE also has an essential role in type I hypersensitivity, which manifests in various allergic diseases, such as allergic asthma, most types of sinusitis, allergic rhinitis, food allergies, and specific types of chronic urticaria and atopic dermatitis. IgE also plays a pivotal role in responses to allergens, such as: anaphylactic reactions to drugs, bee stings, and antigen preparations used in desensitization immunotherapy.
Picture
Picture
ELISA
Linearity
The concentrations of Rat IgE were measured and interpolated from the target standard curves and corrected for sample dilution.
#1 sample is undiluted (5.0%) samples are as follows: SD Rat serum was two-fold dilution. The interpolated dilution factor corrected values are plotted. The mean target concentration was determined to be 109.8 ng/mL in SD Rat serum.
#2 sample is undiluted (10.0%) samples are as follows: SD Rat EDTA plasma was two-fold dilution. The interpolated dilution factor corrected values are plotted. The mean target concentration was determined to be 32.0 ng/mL in SD Rat EDTA plasma.
#3 sample is undiluted (10.0%) samples are as follows: SD Rat Heparin plasma was two-fold dilution. The interpolated dilution factor corrected values are plotted. The mean target concentration was determined to be 43.4 ng/mL in SD Rat Heparin plasma.
#4 sample is undiluted (5.0%) samples are as follows: Wistar Rat Citrate plasma was two-fold dilution. The interpolated dilution factor corrected values are plotted. The mean target concentration was determined to be 33.3 ng/mL in Wistar Rat Citrate plasma.
Spike Recovery
The recovery of Rat IgE was evaluated in activated samples spiked with concentrations spanning the entire assay range.
Specificity
Test the specificity of different species.
Intra-Assay Precision (Precision within an assay)
Three samples of known concentration were tested fifteen times on one plate to assess intra-assay precision.
Inter-Assay Precision (Precision between assays)
Three samples of known concentration were tested in separate assays to assess inter-assay precision. Assays were performed with at least three lots of components.
Determination of Minimum Detectable Dose (MDD)
The MDD was determined using three independent lots of assay components. For each lot, 19 replicate measurements of the diluent (zero calibrator) were performed. The mean (AVERAGE) and standard deviation (STDEV) of the 19 replicates were calculated. The MDD for each lot was then calculated according to the following formula:
MDD = 2 × STDEV + AVERAGE
HOOK Effect Threshold
The upper limit of the HOOK effect was established at 100× the highest calibrator concentration (equivalent to a 2-log10 increase). No HOOK effect was observed below this threshold, confirming that samples within this concentration range yield reliable quantitative results without signal depression.
Leading Competitor comparison
Protocol Diagram