Standard Curve
Example of VSV-G BNP standard curve in Assay Diluent M1. Plotted are the background-subtracted data.
This standard curve is provided for demonstration only.
VSV-G OneStep ELISA Kit
VSV-G OneStep ELISA Kit
Price:
Regular price
$120 USD
Regular price
Sale price
$120 USD
Unit price
per
For shipping services or bulk orders, you may request a quotation.
Secure checkout with

View full details
Product Details
Product Details
Product Specification
| Antigen | VSV-G |
| Immunogen | Recombinant Protein |
| Antibody Type | Recombinant mAb |
| Reactivity | Others |
| Purification | Protein A |
| Stability & Storage | 12 months from date of receipt / reconstitution, 2 to 8°C as supplied. |
Kit
| Precision | Intra-assay: 3.5%; Inter-assay: 5.4% |
| Sample type | Cell Culture Supernatant |
| Assay type | Sandwich (quantitative) |
| Sensitivity | 50.05 pg/mL |
| Range | 0.23 ng/mL – 15 ng/mL |
| Recovery | Cell Culture Supernatant: 95% |
| Assay time | 60 minutes |
| Species reactivity | Others |
Background
VSV-G (vesicular stomatitis virus glycoprotein G) is a 511-amino-acid type I transmembrane glycoprotein produced by vesicular stomatitis virus, an enveloped negative-strand RNA virus. It is the sole viral envelope protein and mediates both receptor binding and pH-dependent membrane fusion. Unlike many fusion proteins that require specific cofactors, VSV-G uses the ubiquitous low-density lipoprotein (LDL) receptor for entry. Its expression is essential for viral infectivity, and in research, VSV-G is widely used to pseudotype lentiviral vectors. In gene transfer studies, efficient pseudotyping with VSV-G serves as a reliable marker for high transduction efficiency across cell types. Researchers commonly employ VSV-G-pseudotyped vectors to deliver genes into hard-to-transfect cells like neurons and stem cells. Because VSV-G confers broad tropism and enhanced particle stability, it is a practical and robust tool for preclinical gene delivery applications. Thus, it plays a valuable role in developing gene therapies and oncolytic virotherapy.
Picture
Picture
ELISA
Spike Recovery
The recovery of VSV-G BNP was evaluated in activated samples spiked with concentrations spanning the entire assay range.
Spike-and-dilution Linearity
To evaluate assay linearity, three samples were spiked with high levels of VSV-G BNP in different matrices and serially diluted with the corresponding Calibrator Diluent to fall within the assay's dynamic range.
Intra-Assay Precision (Precision within an assay)
Three samples of known concentration were tested fifteen times on one plate to assess intra-assay precision.
Inter-Assay Precision (Precision between assays).
Three samples of known concentration were tested in separate assays to assess inter-assay precision. Assays were performed with at least three lots of components.
Determination of Minimum Detectable Dose (MDD)
The MDD was determined using three independent lots of assay components. For each lot, 19 replicate measurements of the diluent (zero calibrator) were performed. The mean (AVERAGE) and standard deviation (STDEV) of the 19 replicates were calculated. The MDD for each lot was then calculated according to the following formula:
MDD = 2 × STDEV + AVERAGE
HOOK Effect Threshold
The upper limit of the HOOK effect was established at 100× the highest calibrator concentration (equivalent to a 2-log10 increase). No HOOK effect was observed below this threshold, confirming that samples within this concentration range yield reliable quantitative results without signal depression.
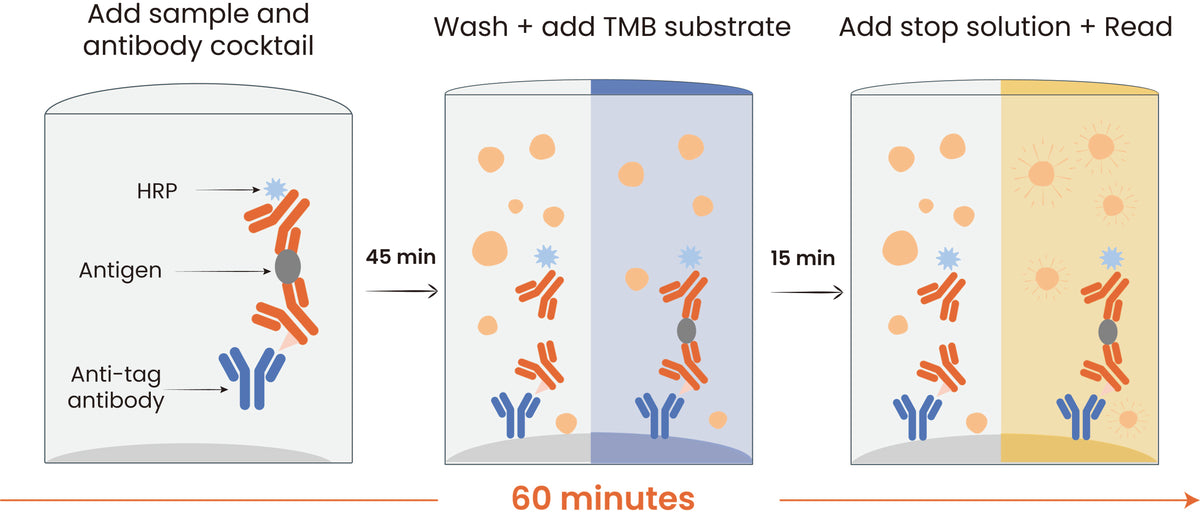
Protocol Diagram