The figure above shows the Panobinostat dose-response curves based on 30-minute detection values, with the left panel displaying raw data and the right panel showing corrected data (detection values minus those from DMSO-treated cells). The calculated Panobinostat EC50 values for UA and PC brand reagents were 49 nM and 48 nM, respectively.
UA-Glo® Caspase 3/7 3D Assay
UA-Glo® Caspase 3/7 3D Assay
Price:
Regular price
$85 USD
Regular price
Sale price
$85 USD
Unit price
per
For shipping services or bulk orders, you may request a quotation.
Secure checkout with

View full details
Product Details
Product Details
Product Specification
Picture
Picture
Bioactivity
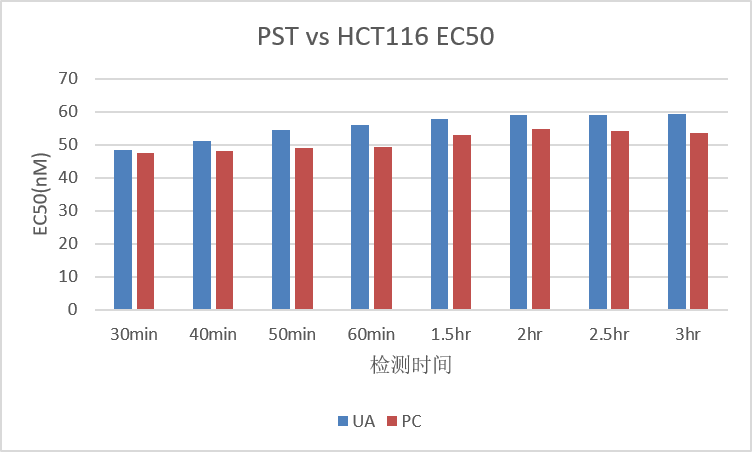
The EC50 of Panobinostat on HCT116 cells calculated from the dose-response curve based on 30-minute to 3-hour measurement values is shown in the figure above. The EC50 values derived from measurements using UA and PC brand reagents are essentially consistent, with a coefficient of variation (CV) for the differences in EC50 within 3 hours less than 7%.