Linearity
Mouse spleen cells were pre-incubated for 24 or 48 h in the presence of R848 and recombinant IL-2.
Four different cryopreservation mouse spleen cells concentrations, 8 replicates, 1 batch. Data presented the mean spot count, range, and coefficient of variation corresponding to the four cell concentrations.
StepSlim Mouse Special IgG (HRP) Plus ELISpot Kit
StepSlim Mouse Special IgG (HRP) Plus ELISpot Kit
Price:
Regular price
$400 USD
Regular price
Sale price
$400 USD
Unit price
per
For shipping services or bulk orders, you may request a quotation.
Secure checkout with

View full details
Product Details
Product Details
Product Specification
| Antigen | IgG |
| Antibody Type | Recombinant mAb |
| Reactivity | Mouse |
| Purification | Protein A |
| Stability & Storage | 12 months from date of receipt / reconstitution, 2 to 8℃ as supplied. |
Kit
| Precision | Intra-assay: 12.11%; Inter-assay: 13.27% |
| Sample type | PBMCs |
| Assay type | Sandwich (Qualitative) |
| Assay time | 18-24hours |
| Species reactivity | Mouse |
| Plate | Strip |
Background
Immunoglobulin G (IgG) is a type of antibody. IgG is the most common type of antibody found in blood circulation. IgG molecules are created and released by plasma B cells. In mice, the IgG class is further divided into four subclasses: IgG1, IgG2a/ IgG2c (strain specific), IgG2b, and IgG3. The mean serum Ig levels found for 6-month-old B6 mice were 0.22 mg/ml for IgM, 0.28 mg/ml for IgG1, 1.22 mg/ml for IgG2b, 0.18 mg/ml for IgG3, 0.075 mg/ml for IgA and about 0.7 mg/ml for IgG2a. This kit is for the quantitative measurement of mouse total IgG in mouse serum, plasma and supernatant from cell cultures.
Picture
Picture
Elispot
Precision
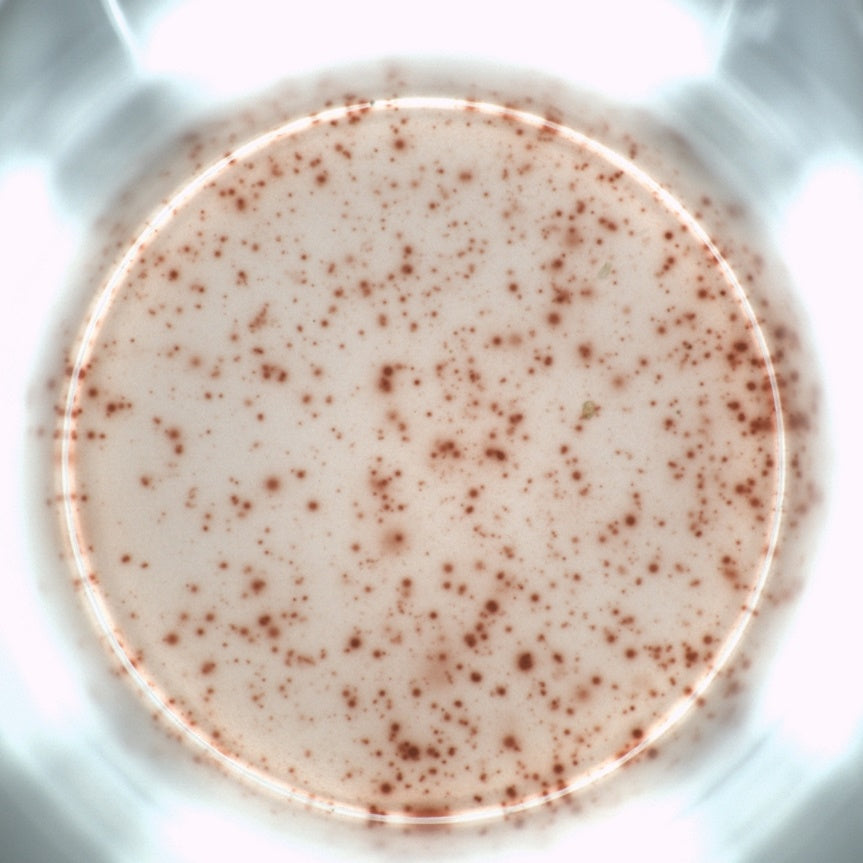
Mouse spleen cells were pre-incubated for 24 h in the presence of R848 and recombinant IL-2.
Following pre-stimulation, the cells were washed and seeded at a density of 5 × 10⁴ cells per well following pre-stimulation, and incubated for 24 hours in a 37°C, 5% CO₂ incubator. Repeat across 8 wells in 3 batches to evaluate inter-batch and intra-batch precision. Data presented include mean spot count, range, and coefficient of variation.
Diagram of spots
After pre-stimulation of mouse spleen cells at 37°C with 5% CO₂ for 24 hours, the cells were incubated with HRP-labelled detection antibodies for 2 hours at room temperature. Then, a colour development substrate was added, followed by image analysis and spot counting.
Protocol Diagram