Linearity
Five different mouse spleen cells concentrations, 8 replicates, 1 batch. Data presented the mean spot count, range, and coefficient of variation corresponding to the five cell concentrations.
StepSlim Mouse IL-2 (ALP) Plus ELISpot Kit
StepSlim Mouse IL-2 (ALP) Plus ELISpot Kit
Price:
Regular price
$365 USD
Regular price
Sale price
$365 USD
Unit price
per
For shipping services or bulk orders, you may request a quotation.
Secure checkout with

View full details
Product Details
Product Details
Product Specification
| Antigen | IL-2 |
| Antibody Type | Recombinant mAb |
| Reactivity | Mouse |
| Purification | Protein A |
| Stability & Storage | 12 months from date of receipt / reconstitution, 2 to 8℃ as supplied. |
Kit
| Precision | Intra-assay: 3.98%; Inter-assay: 5.47% |
| Sample type | Spleen cells |
| Assay type | Sandwich (Qualitative) |
| Assay time | 18-24 hours |
| Species reactivity | Mouse |
| Plate | Strip |
Background
Interleukin 2 (IL-2), also termed T-cell growth factor, is a member of the cytokine family which includes IL-4, IL-7, IL-9, IL-15 and IL-21. Each member of this family has a four alpha helix bundle. IL-2 signals through the IL-2 receptor, a complex consisting of tree subunits, termed alpha, beta and gamma. The IL-2 R gamma is shared by cytokine receptors of all members of cytokine family. Mature mouse IL-2 shares 56% and 73% aa sequence identity with human and rat IL-2, respectively. IL-2 is produced by CD4+ T cell, CD8+ T cells, gamma δ T cells, B cells, dendritic cells and eosinophils, and plays a vital role in key function of the immune system, tolerance and immunity, primarily via its potent stimulatory activity for T cells. Thus, IL-2 may be a key cytokine in the natural suppression of autoimmunity.
Picture
Picture
Elispot
Precision
Stimulate 2×10⁵ cells/well of mouse spleen cells with Con A for 22 hours at 37°C in a 5% CO₂ incubator. Repeat across 8 wells in 3 batches to evaluate inter-batch and intra-batch precision. Data presented include mean spot count, range, and coefficient of variation.
Diagram of spots
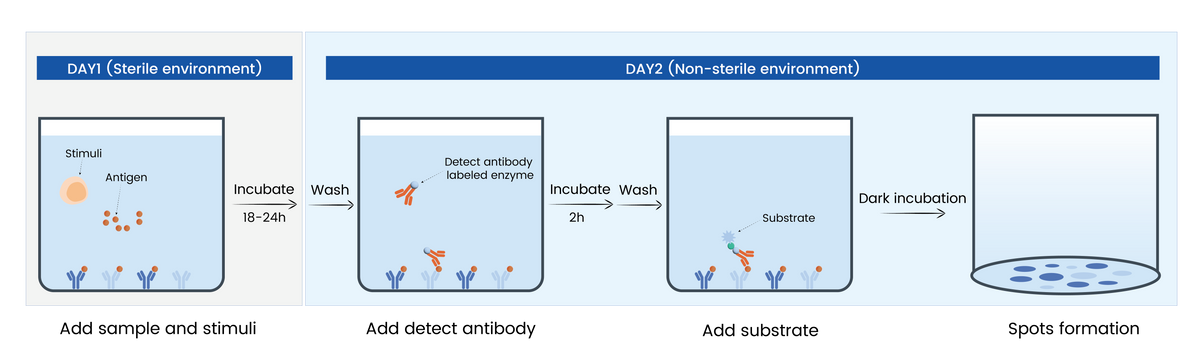
Stimulate 2×10⁵ cells/well of mouse spleen cells with Con A. After 22 hours of stimulation at 37°C in a 5% CO₂ incubator, incubate with ALP-labeled detection antibody at room temperature for 2 hours. Add substrate for color development, followed by image analysis and spot counting.
Protocol Diagram