Standard Curve
Example of Rat IgM standard curve in Assay Diluent A1. Plotted are the background-subtracted data.
This standard curve is provided for demonstration only.
Rat IgM Culture media OneStep ELISA Kit
Rat IgM Culture media OneStep ELISA Kit
Price:
Regular price
$500 USD
Regular price
Sale price
$500 USD
Unit price
per
For shipping services or bulk orders, you may request a quotation.
Secure checkout with

View full details
Product Details
Product Details
Product Specification
| Antigen | IgM |
| Immunogen | Recombinant Protein |
| Antibody Type | Recombinant mAb |
| Reactivity | Rt |
| Purification | Protein A |
| Stability & Storage | 12 months from date of receipt / reconstitution, 2 to 8°C as supplied. |
Kit
| Precision | Intra-assay: 3.5% Inter-assay: 4.9% |
| Sample type | Cell culture supernatant |
| Assay type | Sandwich (quantitative) |
| Sensitivity | 0.156 ng/mL |
| Range | 1.6 ng/mL – 50 ng/mL |
| Recovery | Cell culture supernatant: 98% |
| Assay time | 60 minutes |
Background
Rat immunoglobulin M (IgM) is a primary antibody isotype that plays a critical role in the early immune response of rats, being the first antibody produced upon initial antigen exposure. This protein is predominantly synthesized in the spleen and, due to its large size, remains largely confined to the bloodstream. Structurally, rat IgM in its secreted form is a pentamer, covalently linking five immunoglobulin units (monomers) along with a single joining (J) chain to create a complex with a molecular weight of approximately 900 kDa. Each individual monomer has a molecular weight of about 190 kDa and is composed of two μ heavy chains and two light chains. This pentameric structure theoretically provides up to ten antigen-binding sites, giving it high avidity for multivalent antigens, though not all sites may be able to bind simultaneously due to steric constraints. While the monomeric form is expressed as a membrane-bound receptor on the surface of B cells, the pentameric form is secreted by plasma cells and is highly efficient at activating the complement pathway and promoting agglutination. As such, rat IgM is a crucial component of the humoral immune system and a valuable research tool, often used as a control reagent or a standard in immunological assays like ELISA and Western blotting.
Picture
Picture
ELISA
Spike Recovery
The recovery of Rat IgM was evaluated in activated samples spiked with concentrations spanning the entire assay range.
Determination of Minimum Detectable Dose (MDD)
The MDD was determined using three independent lots of assay components. For each lot, 19 replicate measurements of the diluent (zero calibrator) were performed. The mean (AVERAGE) and standard deviation (STDEV) of the 19 replicates were calculated. The MDD for each lot was then calculated according to the following formula:
MDD = 2 × STDEV + AVERAGE
Intra-Assay Precision (Precision within an assay)
Three samples of known concentration were tested fifteen times on one plate to assess intra-assay precision.
Inter-Assay Precision (Precision between assays)
Three samples of known concentration were tested in separate assays to assess inter-assay precision. Assays were performed with at least three lots of components.
HOOK Effect Threshold
The upper limit of the HOOK effect was established at 100× the highest calibrator concentration (equivalent to a 2-log10 increase). No HOOK effect was observed below this threshold, confirming that samples within this concentration range yield reliable quantitative results without signal depression.
Comparison of Standard Curves from Three Kits
Standard curves from Company A and Starter Onestep were compared.
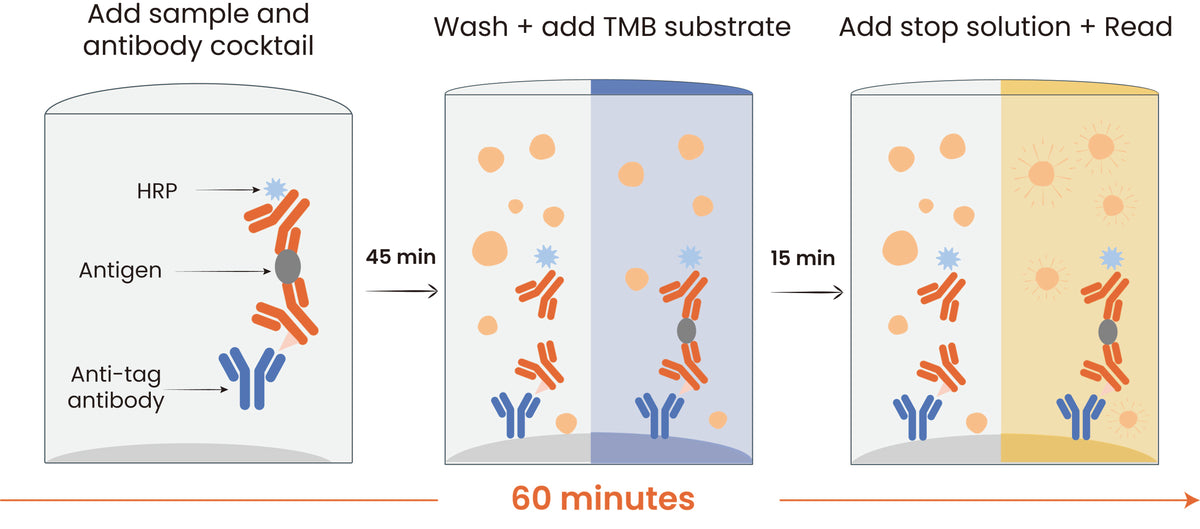
Protocol Diagram