Standard curve
Example of Protein A standard curve in Assay Diluent #8(used Treatment 1).
Protein A OneStep ELISA Kit
Protein A OneStep ELISA Kit
Price:
Regular price
$667 USD
Regular price
Sale price
$667 USD
Unit price
per
For shipping services or bulk orders, you may request a quotation.
Secure checkout with

View full details
Product Details
Product Details
Product Specification
| Antigen | Protein A |
| Immunogen | Recombinant Protein |
| Antibody Type | Recombinant mAb |
| Reactivity | Species Independent |
| Stability & Storage | 12 months from date of receipt / reconstitution, 2 to 8 °C as supplied. |
Kit
| Precision | Intra-assay coefficient of variation: 4.7%; Inter-assay coefficient of variation: 6.3% |
| Sample type | Cell culture supernatant |
| Assay type | Sandwich (quantitative) |
| Sensitivity | 8.910 pg/ml |
| Range | 39.06 pg/mL – 2500 pg/mL |
| Recovery | Rabbit IgG: 89% Human IgG: 110% Mouse IgG: 113% |
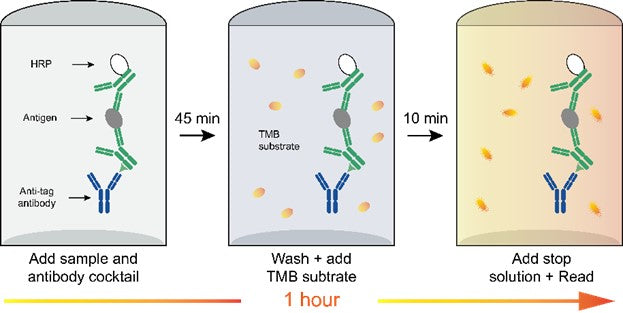
| Assay time | 60 minutes |
Background
Protein A is a bacterial cell wall protein, originally derived from Staphylococcus aureus, that exhibits a high affinity for the Fc region of immunoglobulins (IgG). It is widely used in various applications, such as antibody purification, immunoassays, protein-protein interaction studies, and therapeutic antibody development. Protein A residues can potentially be present in biopharmaceutical products as a result of the purification process using Protein A affinity chromatography. The presence of Protein A residues in the final product is a concern due to their potential immunogenicity and safety implications. Therefore, the detection and quantification of Protein A residues in biopharmaceutical products is crucial for ensuring product quality and patient safety. This simple, sensitive, and fast OneStep ELISA is a powerful method for optimizing purification processes, process control, routine quality control, and product release testing.
Picture
Picture
ELISA
Standard curve
Example of Protein A standard curve in Assay Diluent #8(used Treatment 2).
Linearity
The concentrations of Protein A were measured and interpolated from the target standard curves and corrected for sample dilution.
Sample is undiluted samples are as follows: Rabbit monoclonal antibody sample based on a 100ug/mL antibody load (100%). The interpolated dilution factor corrected values are plotted. The mean target concentration was determined to be 1.3 ng/mL Rabbit monoclonal antibody sample.
Calibration
Test the Protein A standard and domain as follows: B domain of Protein A were calibrated by Protein A standard proteins with a calibration factor (CF) of 0.5. B domain of Protein A concentration = Protein A standard protein concentration/CF
Calibration
Protein A mutant Z domain were calibrated by Protein A standard proteins with a calibration factor (CF) of 0.4;
Protein A mutant Z domain (A1V, N3A, N6D, N23T, G29A, P57I) were calibrated by Protein A standard proteins with a calibration factor (CF) of 0.2. Protein A mutant concentration = Protein A standard protein concentration/CF
Specificity
Simulation Test for the Shedding of Protein A agarose
#1 sample is cytiva MabSelect PrismA(Cat:17549801): C#1, C#2, C#3 and C#4 were treated under different conditions to detect Protein A. C#1 were treated with descaling agents and strong acids; C#2 treated with descaling agents, strong acid and heat; C#3 were treated with descaling agents, strong acids and ultracentrifugation; C#4 treated with descaling agents, strong acids, heat and ultracentrifugation.
Specificity
#2 sample is GenScript Monofinity A Resin(Cat.No.:L00433-500): G#1, G#2, G#3 and G#4 were treated under different conditions to detect Protein A. G#1 were treated with descaling agents and strong acids; G#2 treated with descaling agents, strong acid and heat; G#3 were treated with descaling agents, strong acids and ultracentrifugation; G#4 treated with descaling agents, strong acids, heat and ultracentrifugation.
Leading Competitor comparison
Protocol Diagram