Schematic diagram of Mouse Treg Panel Kit.
Mouse Treg Panel Kit
Mouse Treg Panel Kit
Price:
Regular price
$300 USD
Regular price
Sale price
$300 USD
Unit price
per
For shipping services or bulk orders, you may request a quotation.
Secure checkout with

View full details
Product Details
Product Details
Product Specification
| Application | FCM |
| Reactivity | Ms |
| Positive Sample | Mouse splenocytes |
| Physical Appearance | Liquid |
| Storage Buffer | PBS, 1% BSA, 0.09% sodium azide |
| Stability & Storage | 12 months from date of receipt / reconstitution, 2 to 8 °C as supplied. |
Background
This six‑color panel is designed for detecting regulatory T cells (Tregs) in mouse tissue cells, which are critical for maintaining immune tolerance and suppressing autoreactive T‑cell responses. CD45 was included as a general leukocyte marker to identify all hematopoietic cells. CD3 was included as a general T‑cell marker, and CD4 was included to identify the helper T‑cell population, as Tregs are predominantly found within the CD4+ subset. CD25 (IL‑2 receptor α) is a marker often used to detect Tregs, and Foxp3 is a transcription factor that serves as the most specific marker for Tregs; it is important to note that Foxp3 is an intracellular antigen and requires fixation and permeabilization for staining. The panel is compatible with most three‑laser flow cytometers. If desired, the panel can serve as a backbone panel, allowing for the addition of antibodies conjugated to various fluorophores to detect other markers of interest.
Picture
Picture
FC
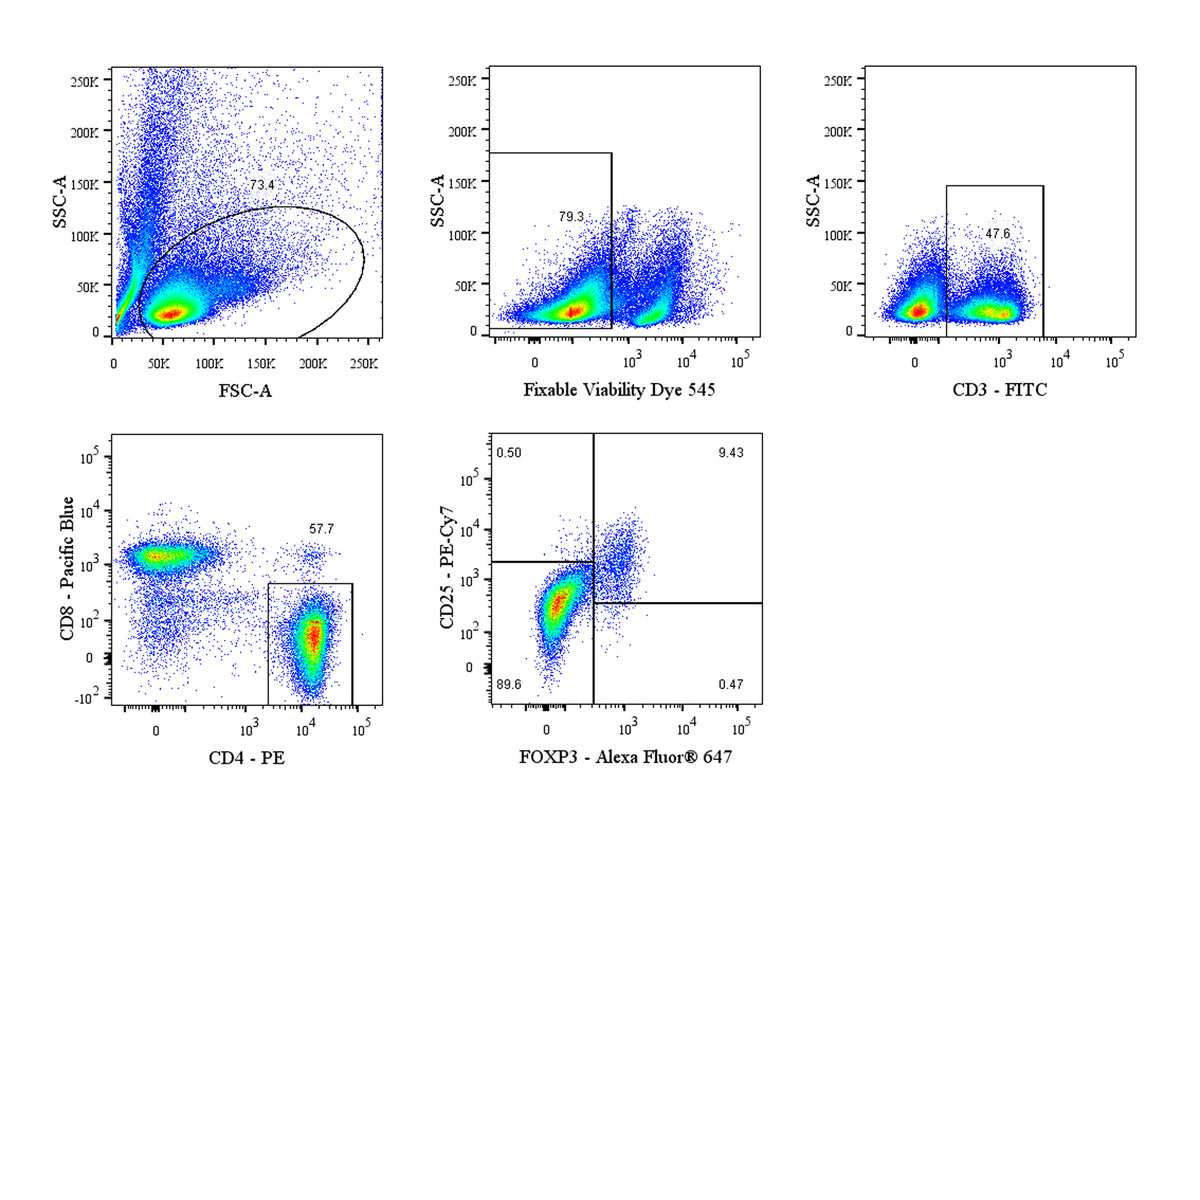
Mouse splenocytes were stained using the Mouse Treg Panel Kit consisting of anti-mouse CD3 FITC, anti-mouse CD4 PE, anti-mouse CD8 Pacific Blue, anti-mouse CD25 PE-Cy7, and anti-mouse FOXP3 Alexa Fluor® 647 conjugated antibodies.
To analyze the data:
1. Create an FSC-A vs SSC-A dot plot and draw a gate around the lymphocyte population.
2. Create a Fixable Viability Dye 545 (S0B88802) vs SSC-A dot plot with the leukocyte gate applied. Draw a gate around the live cell population.
3. Create a CD3 FITC-A vs SSC-A dot plot show the T cells with the live cell gate applied.
4. Create a CD4 PE-A vs CD8 Pacific Blue -A dot plot with the CD3+ gate applied.
5. Create a CD25 PE-Cy7-A vs FOXP3 Alexa Fluor® 647-A dot plot and apply the CD8-CD4+ gate. Create a gate to encompass CD25+ FOXP3+ cells (Treg cells).