Schematic diagram of Mouse T Cell Subset Panel Kit.
Mouse T Cell Subset Panel Kit
Mouse T Cell Subset Panel Kit
Price:
Regular price
$670 USD
Regular price
Sale price
$670 USD
Unit price
per
For shipping services or bulk orders, you may request a quotation.
Secure checkout with

View full details
Product Details
Product Details
Product Specification
| Application | FCM |
| Reactivity | Ms |
| Positive Sample | Mouse splenocytes, Mouse pulmonary cells |
| Physical Appearance | Liquid |
| Storage Buffer | PBS, 1% BSA, 0.09% sodium azide |
| Stability & Storage | 12 months from date of receipt / reconstitution, 2 to 8 °C as supplied. |
Background
This five‑color panel is designed for characterizing T‑cell subpopulations in mouse tissue cells. T cell plasticity plays a vital role in adapting immune responses to various microenvironments, specifically helping the host mount a defense against pathogens that colonize different tissues. CD3 was included as a general T‑cell marker, and CD4 and CD8 were included to identify helper T‑cell and cytotoxic T‑cell subpopulations. The expression pattern of CD44 and CD62L staining on T cells can distinguish distinct memory/effector subsets: naïve T cells (Tn), central memory T cells (Tcm), effector memory T cells (Tem), and effector T cells. The panel is compatible with most three‑laser flow cytometers. If desired, the panel can serve as a backbone panel, allowing for the addition of antibodies conjugated to various fluorophores to detect other markers of interest.
Picture
Picture
FC
Mouse splenocytes were stained using the Mouse T Cell Subset Panel Kit consisting of anti-mouse CD3 FITC, anti-mouse CD4 PerCP-Cy5.5, anti-mouse CD8 PE, anti-mouse CD44 PE-Cy7, and anti-mouse CD62L Alexa Fluor® 647 conjugated antibodies.
To analyze the data:
1. Create an FSC-A vs SSC-A dot plot and draw a gate around the tissue cells excluding cellular debris.
2. Create a Fixable Viability Dye 452 (S0B88801) vs SSC-A dot plot with the tissue cells gate applied. Draw a gate around the live cell population.
3. Create a CD3 FITC-A vs SSC-A dot plot show the T cells with the live cell gate applied.
4. Create a CD4 PerCP-Cy5.5-A vs CD8 PE-A dot plot with the CD3+ gate applied.
5. Create a CD62L Alexa Fluor® 647-A vs CD44 PE-Cy7-A dot plot and apply the CD4+ CD8- gate. Create gates to encompass CD62L+ CD44- cells (Naive T cells, Tn), CD62L+ CD44+ cells (Central memory T cells, Tcm), CD62L- CD44+ cells (Effector memory T cells, Tem), CD62L- CD44- cells (Teff).
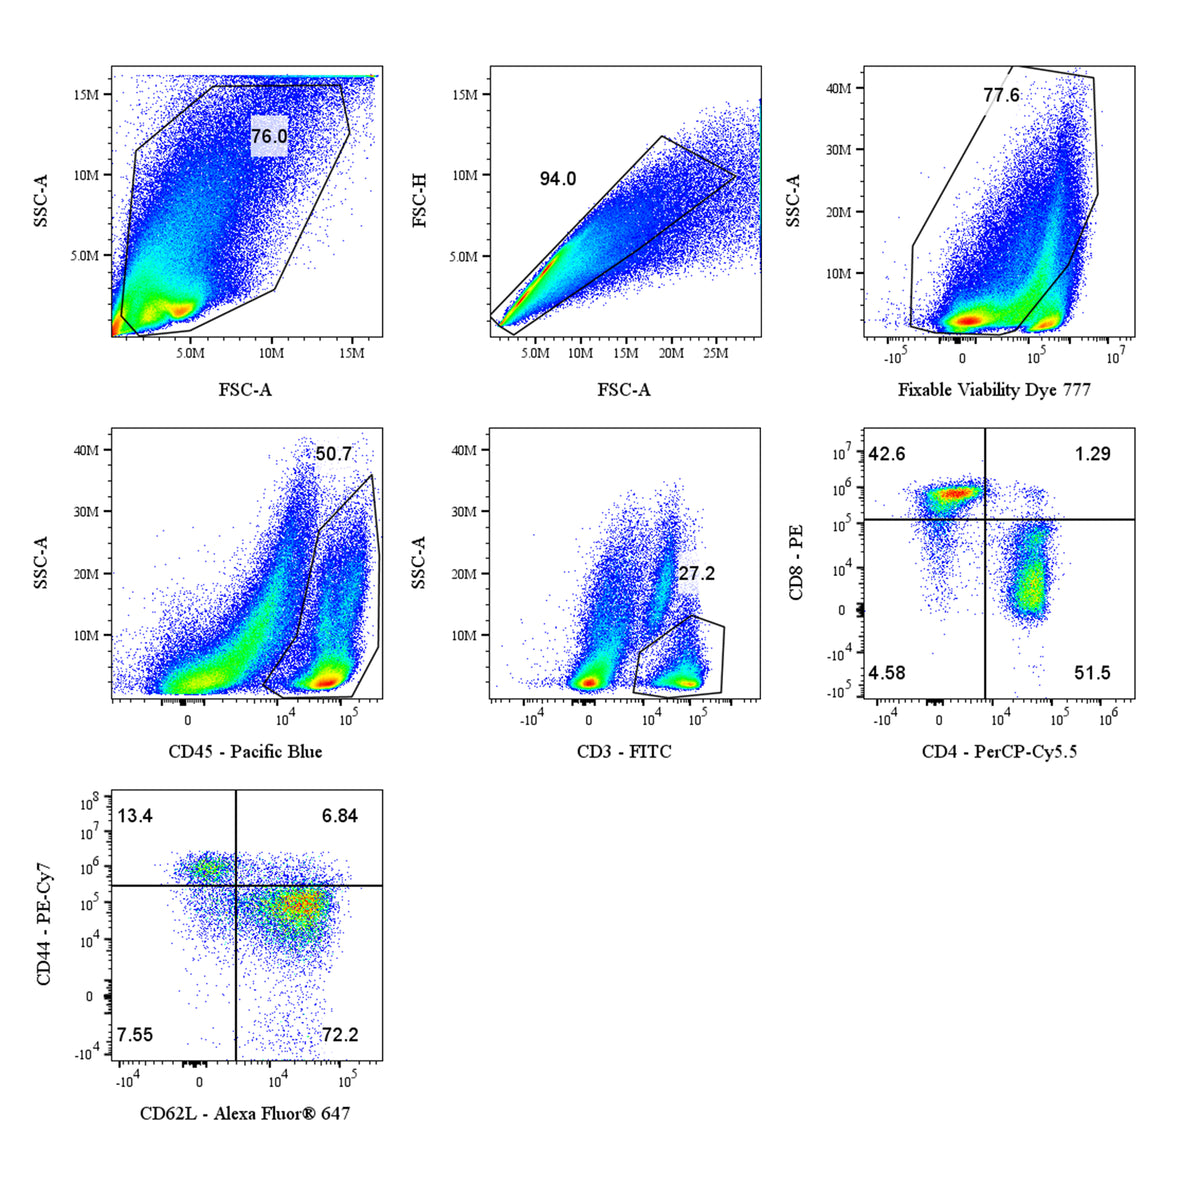
Mouse pulmonary cells were stained using the Mouse T Cell Subset Panel Kit consisting of anti-mouse CD3 FITC, anti-mouse CD4 PerCP-Cy5.5, anti-mouse CD8 PE, anti-mouse CD44 PE-Cy7, and anti-mouse CD62L Alexa Fluor® 647 conjugated antibodies.
To analyze the data:
1. Create an FSC-A vs SSC-A dot plot and draw a gate around the tissue cells excluding cellular debris.
2. Create a Fixable Viability Dye 777 (S0B88805) vs SSC-A dot plot with the tissue cells gate applied. Draw a gate around the live cell population.
3. Create a CD3 FITC-A vs SSC-A dot plot show the T cells with the CD45+ gate applied.
4. Create a CD4 PerCP-Cy5.5-A vs CD8 PE-A dot plot with the CD3+ gate applied.
5. Create a CD62L Alexa Fluor® 647-A vs CD44 PE-Cy7-A dot plot and apply the CD4+ CD8- gate. Create gates to encompass CD62L+ CD44- cells (Naive T cells, Tn), CD62L+ CD44+ cells (Central memory T cells, Tcm), CD62L- CD44+ cells (Effector memory T cells, Tem), CD62L- CD44- cells (Teff).