Standard curve
Example of IFN-α1 standard curve in Assay Diluent .
Mouse IFN-α1 Single Plex Assay (适用于Luminex)
Mouse IFN-α1 Single Plex Assay (适用于Luminex)
Price:
Regular price
$585 USD
Regular price
Sale price
$585 USD
Unit price
per
For shipping services or bulk orders, you may request a quotation.
Secure checkout with

View full details
Product Details
Product Details
Product Specification
| Antigen | IFN-α1 |
| Reactivity | Mouse |
| Stability & Storage | 12 months from date of receipt / reconstitution, 2 to 8°C as supplied. |
Kit
| Precision | Intra-assay: <10%; Inter-assay: <20% |
| Sample type | Serum; Plasma; Cell culture supernatant |
| Assay type | Sandwich (quantitative) |
| Sensitivity | <1pg/mL |
| Range | 0.09pg/mL-62500pg/mL |
| Recovery | Plasma: 80%-120% Serum: 80%-120% Cell culture supernatant: 80%-120% |
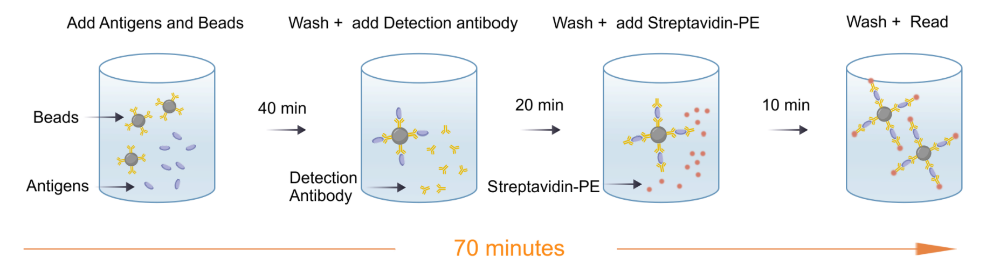
| Assay time | 70 minutes |
| Species reactivity | Mouse |
Background
Mouse IFN-α1 is a key cytokine belonging to the type I interferon family, which is crucial for the innate immune response against viral infections. It is primarily produced by leukocytes, such as macrophages and dendritic cells, upon detection of viral pathogens. This signaling molecule functions by binding to the ubiquitous interferon-α/β receptor (IFNAR) on the surface of target cells. Upon receptor engagement, it activates the classic JAK-STAT signaling pathway, leading to the expression of numerous interferon-stimulated genes (ISGs). These ISGs establish an antiviral state within cells by inhibiting various stages of viral replication and propagation. Due to its potent immunostimulatory effects, mouse IFN-α1 is extensively used in research to study antiviral mechanisms and immune modulation in murine models. It is also employed as a therapeutic agent in experimental settings to treat viral infections and enhance anti-tumor immunity in mice. Thus, it serves as an essential tool for understanding innate immunity and developing novel immunotherapies.
Picture
Picture
Luminex
Quantifiction of Mouse spleen cells
Stimulated sample: Mouse spleen cells were stimulated with 4 ug/mL ConA for 24h, and the average concentration of IFN-α1 in the supernatant was measured to be 61.99 pg/mL.
Unstimulated sample: Mouse spleen cells were cultured for 24h, and the average concentration of IFN-α1 in the supernatant was measured to be 11.35 pg/mL.
Recovery
Within the detection range, the combined cytokine proteins were added to serum,plasma at high、low concentrations.The matrices used in these experiments were diluted 2-fold with the assay buffer before the addition of the cytokine proteins. The results were compared with those of samples that had the same concentration of cytokines added in the assay buffer.
Protocol Diagram