Standard Curve
Example of Monkey TSLP standard curve in Assay Diluent M1. Plotted are the background-subtracted data.
This standard curve is provided for demonstration only.
Monkey TSLP Culture Media OneStep ELISA Kit
Monkey TSLP Culture Media OneStep ELISA Kit
Price:
Regular price
$120 USD
Regular price
Sale price
$120 USD
Unit price
per
For shipping services or bulk orders, you may request a quotation.
Secure checkout with

View full details
Product Details
Product Details
Product Specification
| Antigen | Monkey TSLP |
| Immunogen | Recombinant Protein |
| Antibody Type | Recombinant mAb |
| Reactivity | Mk |
| Purification | Protein A |
| Stability & Storage | 12 months from date of receipt / reconstitution, 2 to 8°C as supplied. |
Kit
| Precision | Intra-assay: 4.9%; Inter-assay: 5.1% |
| Sample type | Cell Culture Supernatant; |
| Assay type | Sandwich (quantitative) |
| Sensitivity | 23.88 pg/mL |
| Range | 31.3 pg/mL – 2000 pg/mL |
| Recovery | Cell Culture Supernatant: 88% |
| Assay time | 60 minutes |
| Species reactivity | Mk |
Background
Monkey TSLP (Thymic Stromal Lymphopoietin) is a ~140 amino acid, 16 kDa cytokine of the IL-2 family that contains a furin cleavage site (127-RRKR-130), yielding an ~11.7 kDa N-terminal and ~5.4 kDa C-terminal fragment, and is commonly produced as a C-terminal His-tagged recombinant protein spanning Tyr29–Gln159. Because the TSLP pathway is conserved between humans and cynomolgus monkeys, monkey TSLP serves as a key translational model for human allergic disease, particularly asthma, where TSLPR blockade significantly reduced bronchoalveolar lavage eosinophils, lung resistance, IL-13 levels, and the TSLP-DC gene signature, confirming that TSLP-driven dendritic cell activation plays a central role in allergic inflammation.
Picture
Picture
ELISA
Spike Recovery
The recovery of Monkey TSLP was evaluated in medium spiked with concentrations spanning the entire assay range.
Spike-and-dilution Linearity
To evaluate assay linearity, samples were spiked with high levels of Monkey TSLP in matrices and serially diluted with the corresponding Calibrator Diluent to fall within the assay's dynamic range.
Intra-Assay Precision (Precision within an assay)
Three samples of known concentration were tested fifteen times on one plate to assess intra-assay precision.
Inter-Assay Precision (Precision between assays).
Three samples of known concentration were tested in separate assays to assess inter-assay precision. Assays were performed with at least three lots of components.
Determination of Minimum Detectable Dose (MDD)
The MDD was determined using three independent lots of assay components. For each lot, 19 replicate measurements of the diluent (zero calibrator) were performed. The mean (AVERAGE) and standard deviation (STDEV) of the 19 replicates were calculated. The MDD for each lot was then calculated according to the following formula:
MDD = 2 × STDEV + AVERAGE
HOOK Effect Threshold
The upper limit of the HOOK effect was established at 100× the highest calibrator concentration (equivalent to a 2-log10 increase). No HOOK effect was observed below this threshold, confirming that samples within this concentration range yield reliable quantitative results without signal depression.
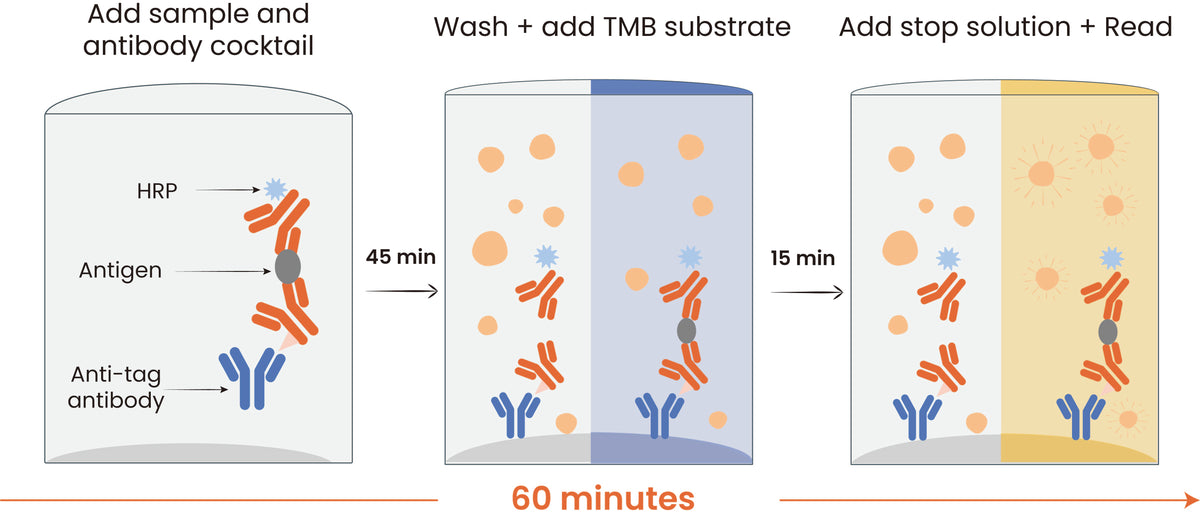
Protocol Diagram