Standard curve
Example of TNF-α standard curve in Assay Diluent .
Human TNF-α Single Plex Kit (Flow Cytometry Bead Assay)
Human TNF-α Single Plex Kit (Flow Cytometry Bead Assay)
Price:
Regular price
$500 USD
Regular price
Sale price
$500 USD
Unit price
per
For shipping services or bulk orders, you may request a quotation.
Secure checkout with

View full details
Product Details
Product Details
Product Specification
| Antigen | TNF-α |
| Reactivity | Human |
| Stability & Storage | 12 months from date of receipt / reconstitution, 2 to 8°C as supplied. |
Kit
| Precision | Intra-assay: 5%; Inter-assay: 10% |
| Sample type | Serum; Plasma; Cell culture supernatant |
| Assay type | Sandwich (quantitative) |
| Sensitivity | 0.70 pg/mL |
| Range | 2.56 pg/mL-5250 pg/mL |
| Recovery | Plasma: 111% Serum: 91% Cell culture supernatant: 122% |
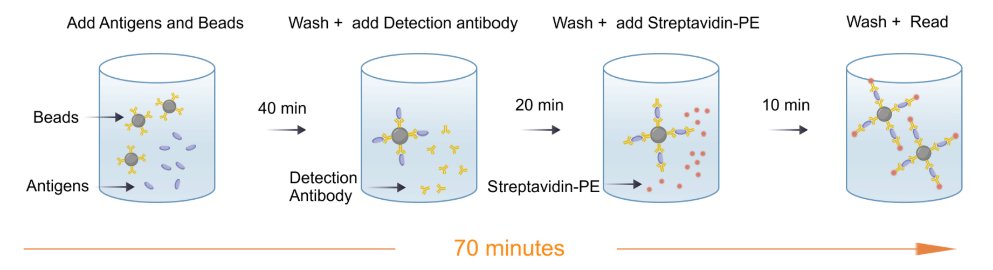
| Assay time | 70 minutes |
| Species reactivity | Human |
Background
TNF-α, which stands for Tumor Necrosis Factor-alpha, is a potent signaling molecule crucial for immune system regulation. It is primarily produced by activated macrophages, but also by other immune cells like T lymphocytes and mast cells. Its main role is to orchestrate inflammation, a key defense mechanism against infection and injury. TNF-α promotes the activation of immune cells and induces fever by acting on the hypothalamus. Furthermore, it can trigger programmed cell death (apoptosis) in certain tumor cells, which is how it earned its name. While essential for host defense, excessive or chronic production of TNF-α is a major driver of inflammatory diseases, such as rheumatoid arthritis and Crohn's disease. This has made it a critical therapeutic target, with drugs blocking TNF-α being widely used. In essence, TNF-α is a master regulator of inflammation, with powerful but potentially harmful effects that must be tightly controlled.
Picture
Picture
CBA
Quantifiction of human PBMC
Stimulated sample: Human peripheral blood mononuclear cells (PBMCs) were stimulated with 10 ng/mL PMA for 24h, and the average concentration of TNF-α in the supernatant was measured to be 6302.40 pg/mL.
Unstimulated sample: Human PBMCs were cultured for 24h, and the average concentration of TNF-α in the supernatant was measured to be 150.29 pg/mL.
Linearity
The high-concentration human TNF-α protein was serially diluted using plasma, serum and cell culture supernatant matrices respectively. Then, the concentration of human TNF-α was determined and interpolated based on the target standard curve, and the sample dilution was corrected.
Protocol Diagram