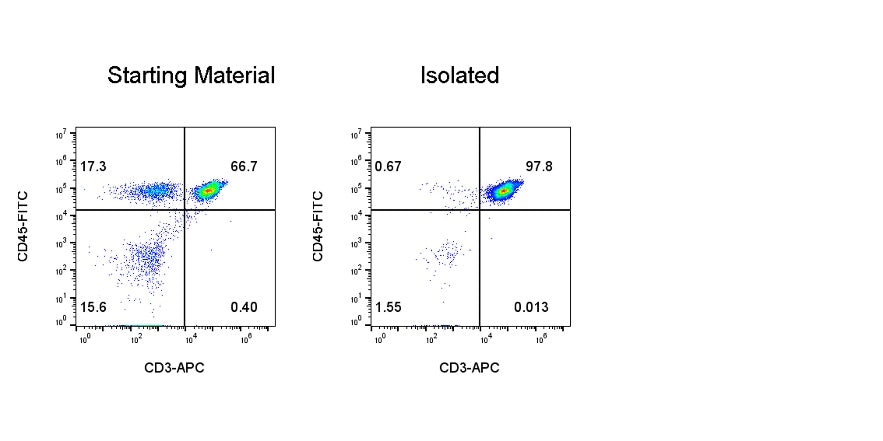
Human T cells were enriched from peripheral blood mononuclear cells (PBMCs). After fluorescent staining with CD45-FITC (SDT Cat: S0B8067) and CD3-APC (SDT Cat: S0B5722), live cells (Live+) were gated for analysis. Flow cytometry results showed that the purity of the sorted Human T cells was 97.8%.
Human T Cell Isolation Kit (Column-Based)
Human T Cell Isolation Kit (Column-Based)
Price:
Regular price
$1,000 USD
Regular price
Sale price
$1,000 USD
Unit price
per
For shipping services or bulk orders, you may request a quotation.
Secure checkout with

View full details
Product Details
Product Details
Product Specification
| Format |
1 mL Human T Cell Biotin-Antibody Cocktail 1 mL Streptavidin Beads |
| Capacity | Suitable for a total cell count of 1×10⁹, and can perform up to 100 sorting runs. |
| Principle of Separation | In this negative selection process, non-T cells are labeled with biotin-conjugated antibodies, and the cells are then incubated with streptavidin-coated nanomagnetic beads. As a result, the non-target cells are marked by the antibody‑bead complex, while the target T cells remain unlabeled. Subsequently, the cell suspension is transferred to a separation column; under the influence of a magnetic field, the magnetically labeled non-target cells are retained in the column, whereas the unlabeled T cells elute into a collection tube under gravity. The resulting supernatant represents the T-cell‑enriched fraction after removal of the non-target cells. |
| Reactivity | Human |
| Magnetic Bead Size | 20 nm |
| Separation Method | Column-Based |
| Selection Strategy | Negative Selection |
| Stability & Storage | Store protected from light at 2–8 °C; do not freeze. |
Background
Human T cells are key immune cells in the immune system, playing a central role in immune responses, immune regulation, and defense against infection and tumors. This kit employs a column-based negative selection approach: non-T cells are labeled with biotin-conjugated antibodies, and unwanted cells are removed using magnetic bead separation, thereby enriching highly pure, high‑activity T cells. This method avoids the potential impact of direct labeling on T cell function and is suitable for downstream experimental studies such as cell culture and functional assays.
Protocol
Note: This kit does not include the separation buffer; you need to prepare it yourself. The corresponding Stater catalog number isS0D3018
TakingL Separation Columnas an example
Steps |
Operating instructions |
Dosage and time |
|
Cell processing and labeling |
1 |
Isolate PBMCs from peripheral blood using density gradient centrifugation with lymphocyte separation solution, or directly thaw cryopreserved PBMC cells, and then perform cell counting. Note: It is recommended to count cells after staining with AO/PI; PBMCs can be centrifuged at 400 g for 7 minutes. |
Prepare the sample |
2 |
Resuspend 1×10^7 cells in 100 μL of MagSep Separation Buffer.7cells; Note:Adjust reagents proportionally according to the sample volume; set aside a pre-sorting sample to determine the proportion of human T cells. |
1×10^77cells/100 μL |
|
3 |
Add 10 μL of Human T cell Biotin Antibody Cocktail to the sample and gently mix. Note:In this step, gently pipette up and down 2–3 times to mix thoroughly; |
10 μL/100 μL |
|
4 |
Incubate the antibodies in the cocktail with the cells at room temperature for 10 minutes; |
Incubate at room temperature for 10 minutes |
|
5 |
Mix wellStreptavidin Beads, add 10 μLStreptavidin Beadsinto the sample; |
10 μL/100 μL |
|
6 |
Gently mix the magnetic beads and cells, and incubate at room temperature for 5 minutes; |
Incubate at room temperature for 5 minutes |
|
Cell sorting |
7 |
Place it in the column-type magnetic separator,L Separation Column, add 3 mL of MagSep Separation Buffer to rinse the separation column; |
Rinse the separation column |
8 |
Add the cells to the separation column and collect the target cells using a collection tube; Note:The cell volume should be at least 500 μL; if insufficient, add MagSep Separation Buffer to make up the volume. The cells that drip down under gravity are the target cells. |
Collect the target cells |
|
9 |
Add 3 mL of MagSep Separation Buffer and collect the target cells. Note:In this step, elute the unlabeled target cells from the separation column to increase the yield. |
Collect the target cells |
|
Notes: Pay attention to the maximum capacity of the separation column.The maximum number of labeled cells in an S Separation Column is1×107;The maximum number of labeled cells in an L Separation Column is1×108; | |||
Picture
Picture
Validation Data