Standard curve
Example of Human C-peptide standard curve in Assay Diluent DD5.
Human & Monkey C-peptide OneStep ELISA Kit
Human & Monkey C-peptide OneStep ELISA Kit
Price:
Regular price
$500 USD
Regular price
Sale price
$500 USD
Unit price
per
For shipping services or bulk orders, you may request a quotation.
Secure checkout with

View full details
Product Details
Product Details
Product Specification
| Antigen | C-peptide |
| Immunogen | Recombinant Protein |
| Antibody Type | Recombinant mAb |
| Reactivity | Hu, Mk |
| Purification | Protein A |
| Stability & Storage | 12 months from date of receipt / reconstitution, 2 to 8°C as supplied. |
Kit
| Precision | Intra-assay: 1.4% Inter-assay: 2.7% |
| Sample type | Cell culture supernatant; Serum; Plasma |
| Assay type | Sandwich (quantitative) |
| Sensitivity | 10.917 pg/mL |
| Range | 46.88 pg/mL – 3000 pg/mL (0.16 nmol/L – 1.00 nmol/L) |
| Recovery | Cell culture supernatant: 91% Human Serum: 119% Citrate Human plasma: 97% |
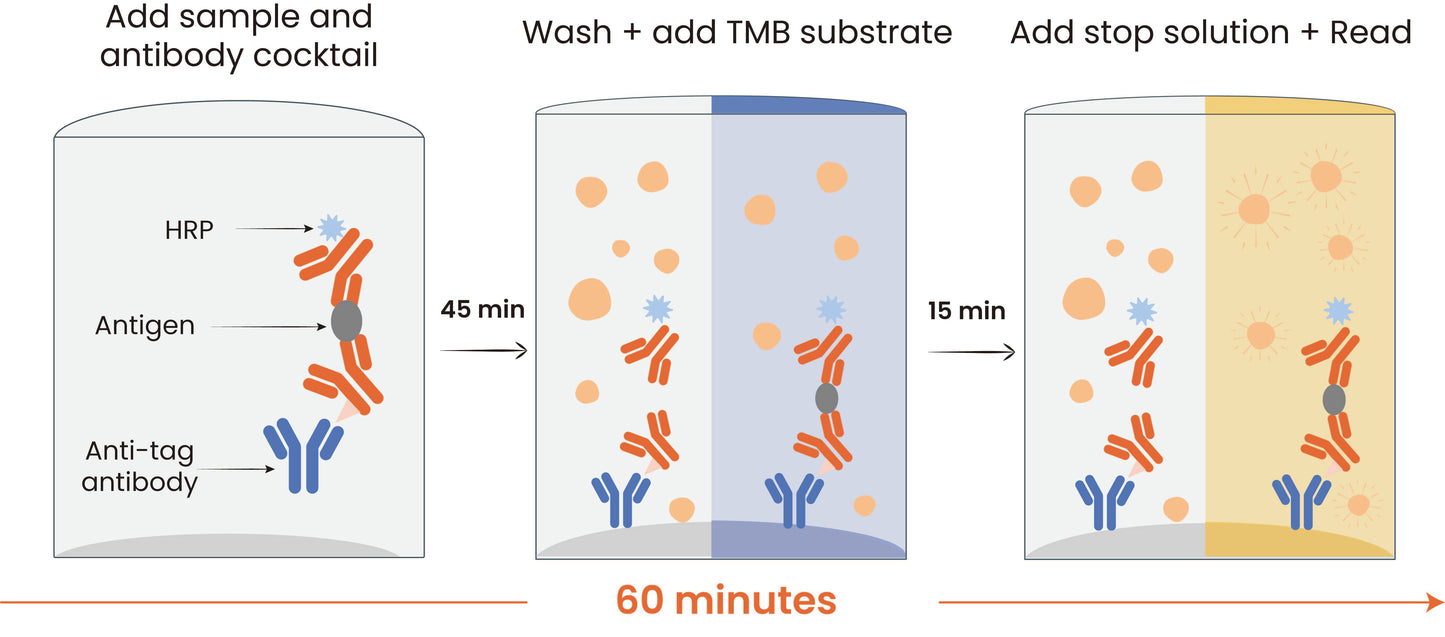
| Assay time | 60 minutes |
| Species reactivity | Hu; Mk |
Background
Human C-peptide is a 31-amino-acid peptide that connects the A and B chains of proinsulin in the human pancreas, released into the bloodstream in equimolar amounts to insulin and serving as a critical marker of endogenous insulin secretion; clinically, its measurement helps distinguish between type 1 and type 2 diabetes, evaluate residual beta-cell function, diagnose insulinomas, and assess causes of hypoglycemia, since synthetic insulin preparations do not contain C-peptide. Monkey C-peptide is highly similar to human C-peptide in both structure and function, reflecting the close phylogenetic relationship between humans and non-human primates—Old World monkeys (e.g., macaques) typically have a C-peptide sequence differing from humans by only a few amino acids while maintaining comparable bioinertness and stoichiometric release with insulin. In preclinical research and toxicology studies, monkey C-peptide is measured as a translational biomarker to evaluate pancreatic beta-cell health, insulin secretion dynamics, and the diabetogenic potential of novel drugs. Thus, both human and monkey C-peptides are valuable biomarkers for insulin production, and their structural homology supports the use of monkeys as relevant models for human metabolic and diabetic research; however, species-specific assays are often required for accurate quantification due to minor sequence variations.
Picture
Picture
ELISA
Standard curve
Example of Human C-peptide standard curve in Assay Diluent DD5.
Linearity
The concentrations of Human C-peptide were measured and interpolated from the target standard curves and corrected for sample dilution.
#1 sample is undiluted samples are as follows: Human serum donor #1 was 4fold dilution. The interpolated dilution factor corrected values are plotted. The mean target concentration was determined to be 3255.81 pg/mL in human serum donor #1.
#2 sample is undiluted samples are as follows: Human serum donor #2 was 4fold dilution. The interpolated dilution factor corrected values are plotted. The mean target concentration was determined to be 3113.40 pg/mL in human serum donor #2.
#3 sample is undiluted samples are as follows: Human plasma-EDTA was 4fold dilution. The interpolated dilution factor corrected values are plotted. The mean target concentration was determined to be 3817.99 pg/mL in human plasma-EDTA.
#4 sample is undiluted samples are as follows: Female monkey serum was 4fold dilution. The interpolated dilution factor corrected values are plotted. The mean target concentration was determined to be 160.46 pg/mL in female monkey serum.
#5 sample is undiluted samples are as follows: Monkey plasma-EDTA was 4fold dilution. The interpolated dilution factor corrected values are plotted. The mean target concentration was determined to be 858.96 pg/mL in monkey plasma-EDTA.
Protocol Diagram