Standard curve
Example of IP-10/CXCL10 standard curve in Assay Diluent .
Human IP-10/CXCL10 Single Plex Assay (适用于Luminex)
Human IP-10/CXCL10 Single Plex Assay (适用于Luminex)
Price:
Regular price
$585 USD
Regular price
Sale price
$585 USD
Unit price
per
For shipping services or bulk orders, you may request a quotation.
Secure checkout with

View full details
Product Details
Product Details
Product Specification
| Antigen | IP-10/CXCL10 |
| Reactivity | Human |
| Stability & Storage | 12 months from date of receipt / reconstitution, 2 to 8°C as supplied. |
Kit
| Precision | Intra-assay: <10%; Inter-assay: <15% |
| Sample type | Serum; Plasma; Cell culture supernatant |
| Assay type | Sandwich (quantitative) |
| Sensitivity | <1 pg/mL |
| Range | 1.04pg/mL-20000pg/mL |
| Recovery | Plasma: 80%-120% Serum: 80%-120% Cell culture supernatant: 80%-120% |
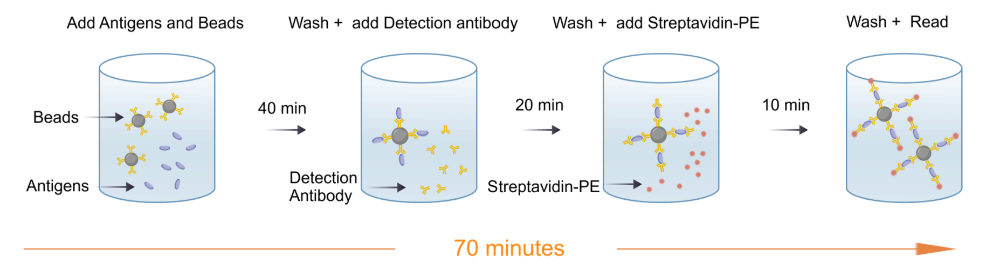
| Assay time | 70 minutes |
| Species reactivity | Human |
Background
CXCL10 is a small signaling protein classified as a chemokine. It is primarily produced by cells like macrophages and fibroblasts in response to interferon-gamma. Its main function is to act as a chemoattractant, guiding immune cells to sites of inflammation or infection. Specifically, CXCL10 binds to a receptor called CXCR3, which is found on the surface of activated T cells and natural killer (NK) cells. This interaction is crucial for mounting an effective immune response against viruses and intracellular pathogens. Consequently, CXCL10 plays a significant role in autoimmune diseases, chronic inflammation, and anti-tumor immunity. Its expression is often used as a biomarker for Th1-type immune responses. In summary, CXCL10 is a key mediator that recruits specific immune cells to coordinate the body's defense mechanisms.
Picture
Picture
Luminex
Quantifiction of human PBMC
Stimulated sample: Human peripheral blood mononuclear cells (PBMCs) were stimulated with PHA、LPS、Lono and the average concentration of IP-10/CXCL10 in the supernatant was measured to be 836.23 pg/mL.
Unstimulated sample: Human PBMCs were cultured for 24h, and the average concentration of IP-10/CXCL10 in the supernatant was measured to be 1.47 pg/mL.
Recovery
Within the detection range, the combined cytokine proteins were added to serum,plasma,cell supernatant at high、low concentrations.The matrices used in these experiments were diluted 2-fold with the assay buffer before the addition of the cytokine proteins. The results were compared with those of samples that had the same concentration of cytokines added in the assay buffer.
Protocol Diagram