Standard Curve
Example of Human IgG3 standard curve in Assay Diluent A1. Plotted are the background-subtracted data.
This standard curve is provided for demonstration only.
Human IgG3 OneStep ELISA Kit
Human IgG3 OneStep ELISA Kit
Price:
Regular price
$250 USD
Regular price
Sale price
$250 USD
Unit price
per
For shipping services or bulk orders, you may request a quotation.
Secure checkout with

View full details
Product Details
Product Details
Product Specification
| Antigen | IgG3 |
| Immunogen | Recombinant Protein |
| Antibody Type | Recombinant mAb |
| Reactivity | Hu |
| Purification | Protein A |
| Stability & Storage | 12 months from date of receipt / reconstitution, 2 to 8°C as supplied. |
Kit
| Precision | Intra-assay: 6.1%; Inter-assay: 8.1% |
| Sample type | Serum; EDTA Plasma, Heparin Plasma, Citrate Plasma; Cell Culture Supernatant |
| Assay type | Sandwich (quantitative) |
| Sensitivity | 0.144 ng/mL |
| Range | 0.47 ng/mL – 30 ng/mL |
| Recovery | Serum: 97% EDTA Plasma: 85% Citrate plasma: 97% Heparin Plasma: 94% Cell Culture Supernatant: 89% |
| Assay time | 60 minutes |
| Species reactivity | Hu |
Background
Human Immunoglobulin G subclass 3 (IgG3) is a potent but relatively low-abundance IgG subclass (comprising approximately 4–8% of total serum IgG) distinguished by its uniquely long and flexible hinge region rich in proline and cysteine residues, which contains up to 62 amino acids and 11 inter-heavy chain disulfide bonds—structural features that confer exceptional conformational flexibility. Functionally, IgG3 is the most potent activator of the classical complement pathway due to its superior C1q binding capacity, and it also exhibits high affinity for Fc gamma receptors (particularly FcγRI and FcγRIIIA), driving robust antibody-dependent cellular cytotoxicity (ADCC) and phagocytosis. It plays a critical role in defense against encapsulated bacteria and viruses and is preferentially induced in T-cell-dependent immune responses, yet its strong pro-inflammatory properties also link it to autoimmune pathologies such as systemic lupus erythematosus and rheumatoid arthritis. Unlike other IgG subclasses, IgG3 has a significantly shorter serum half-life of approximately 7–10 days owing to reduced FcRn-mediated recycling, which poses challenges for therapeutic development despite its potent effector functions. Overall, IgG3's unique structural and functional attributes make it a vital component of humoral immunity and an intriguing, albeit complex, candidate for monoclonal antibody engineering.
Picture
Picture
ELISA
Spike Recovery
The recovery of Human IgG3 was evaluated in activated samples spiked with concentrations spanning the entire assay range.
Dilution Linearity
The concentrations of Human IgG3 were measured and interpolated from the target standard curves and corrected for sample dilution.
The leftmost bar in the graph shows biological samples diluted 20,000-fold in Assay Diluent. "Undiluted" was defined as biological sample diluted 20,000-fold. The mean target concentration was determined to be 438.40 ug/mL in Human serum; The mean target concentration was determined to be 213.48 ug/mL in Human plasma-EDTA; The mean target concentration was determined to be 97.76 ug/mL in Human plasma -Citrate; The mean target concentration was determined to be 448.91 ug/mL in Human plasma -Heparin.
Dilution Linearity
The concentrations of Human IgG3 were measured and interpolated from the target standard curves and corrected for sample dilution.
The leftmost bar in the graph shows biological samples diluted 20,000-fold in Assay Diluent. "Undiluted" was defined as biological sample diluted 20,000-fold. The mean target concentration was determined to be 110.3 ug/mL in Human serum donor #1; The mean target concentration was determined to be 500.4 ug/mL in Human plasma donor #1.
Dilution Linearity
The concentrations of Human IgG3 were measured and interpolated from the target standard curves and corrected for sample dilution.
The leftmost bar in the graph shows biological samples diluted in Assay Diluent to 1% concentration. "undiluted" was defined as 1% biological sample. The subsequent bars represent two-fold serial dilutions of this reference. The mean target concentration was determined to be 316.1 ng/mL in Human breast milk.
Spike-and-dilution Linearity
To evaluate assay linearity, three samples were spiked with high levels of Human IgG3 in different matrices and serially diluted with the corresponding Calibrator Diluent to fall within the assay's dynamic range.
Intra-Assay Precision (Precision within an assay)
Three samples of known concentration were tested fifteen times on one plate to assess intra-assay precision.
Inter-Assay Precision (Precision between assays).
Three samples of known concentration were tested in separate assays to assess inter-assay precision. Assays were performed with at least three lots of components.
Determination of Minimum Detectable Dose (MDD)
The MDD was determined using three independent lots of assay components. For each lot, 19 replicate measurements of the diluent (zero calibrator) were performed. The mean (AVERAGE) and standard deviation (STDEV) of the 19 replicates were calculated. The MDD for each lot was then calculated according to the following formula:
MDD = 2 × STDEV + AVERAGE
Cross‑reactivity
The cross‑reactivity among Human IgG1, Human IgG2, Human IgG3, Human IgG4, Monkey IgG1, Monkey IgG2, Monkey IgG3, and Monkey IgG4 was assessed by testing each protein in the same assay system. When these proteins were measured in the Human IgG3 assay, no significant cross‑reactivity was observed, as all signals remained within the background threshold range of the assay.
Cross‑reactivity
The heatmap displays OD450 ratios for serum samples from multiple species. Color intensity is proportional to the O.D.450 ratio (test species / reference species). Darker colors indicate higher cross‑reactivity.
HOOK Effect Threshold
The upper limit of the HOOK effect was established at 100× the highest calibrator concentration (equivalent to a 2-log10 increase). No HOOK effect was observed below this threshold, confirming that samples within this concentration range yield reliable quantitative results without signal depression.
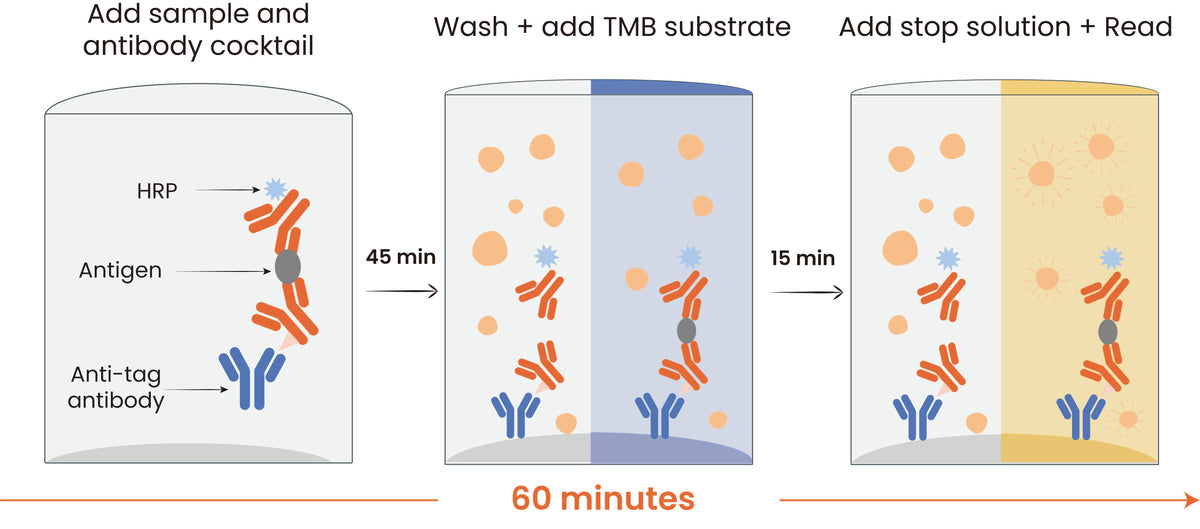
Protocol Diagram