Standard curve
Example of Human CXCL1 standard curve in Assay Diluent TA2.
Human CXCL1/GRO α serum & plasma OneStep ELISA Kit
Human CXCL1/GRO α serum & plasma OneStep ELISA Kit
Price:
Regular price
$200 USD
Regular price
Sale price
$200 USD
Unit price
per
For shipping services or bulk orders, you may request a quotation.
Secure checkout with

View full details
Product Details
Product Details
Product Specification
| Antigen | CXCL1 |
| Immunogen | Recombinant Protein |
| Antibody Type | Recombinant mAb |
| Reactivity | Hu |
| Purification | Protein A |
| Stability & Storage | 12 months from date of receipt / reconstitution, 2 to 8°C as supplied. |
Kit
| Precision | Intra-assay: 3.0% Inter-assay: 3.6% |
| Sample type | Serum; Plasma |
| Assay type | Sandwich (quantitative) |
| Sensitivity | 0.90 pg/mL |
| Range | 9.4 pg/mL – 600 pg/mL |
| Recovery | Human Serum: 87% Heparin Plasma: 100% EDTA Plasma: 98% Citrate Plasma: 94% |
| Assay time | 60 minutes |
Background
Human CXCL1, also known as Growth-regulated alpha protein (GRO-α) or Melanoma Growth Stimulatory Activity (MGSA), is a small cytokine belonging to the CXC chemokine family. It is a secreted growth factor that signals primarily through the G-protein coupled receptor CXCR2, and at higher concentrations can also activate CXCR1. The protein's main function is to act as a potent chemoattractant for neutrophils, playing a critical role in inflammation and innate immune responses. Notably, naturally occurring processed forms of CXCL1 (such as GRO-alpha 4-73) exhibit a 30-fold higher chemotactic activity compared to the full-length protein. Recombinant human CXCL1 is commercially available in various forms, including a 73-amino-acid variant with a predicted molecular mass of 7.9 kDa, as well as tagged versions for research applications. Beyond its role in inflammation, aberrant expression of CXCL1 is strongly associated with the growth and progression of certain tumors, making it a target of interest in cancer research.
Picture
Picture
ELISA
Spike Recovery
The recovery of Human CXCL1 was evaluated in activated samples spiked with concentrations spanning the entire assay range.
Cross-reactivity
The heatmap displays OD450 ratios for serum samples from multiple species. Color intensity is proportional to the O.D.450 ratio (test species / reference species). Darker colors indicate higher cross-reactivity.
Spike-and-dilution Linearity
To evaluate assay linearity, serum sample was spiked with high levels of Human CXCL1 in different matrices and serially diluted with the corresponding Calibrator Diluent to fall within the assay's dynamic range.
Spike-and-dilution Linearity
To evaluate assay linearity, plasma sample was spiked with high levels of Human CXCL1 in different matrices and serially diluted with the corresponding Calibrator Diluent to fall within the assay's dynamic range.
Cross-reactivity
The cross-reactivity between Mouse CXCL1 and Human CXCL1 was assessed by testing both proteins in the same assay system. Serial dilutions of each protein were measured, and the dose-response curves were compared. No significant cross-reactivity was observed when Human CXCL1 was tested in the Mouse CXCL1 assay, as the signals remained within the background range of the assay.
Determination of Minimum Detectable Dose (MDD)
The MDD was determined using three independent lots of assay components. For each lot, 19 replicate measurements of the diluent (zero calibrator) were performed. The mean (AVERAGE) and standard deviation (STDEV) of the 19 replicates were calculated. The MDD for each lot was then calculated according to the following formula:
MDD = 2 × STDEV + AVERAGE
Dilution Linearity
The concentrations of Human CXCL1 were measured and interpolated from the target standard curves and corrected for sample dilution.
The leftmost bar in the graph shows biological samples diluted in Assay Diluent to 25% concentration. "undiluted" was defined as 25% biological sample. The subsequent bars represent two-fold serial dilutions of this reference. The mean target concentration was determined to be 335.58 pg/mL in Human serum.
Dilution Linearity
The concentrations of Human CXCL1 were measured and interpolated from the target standard curves and corrected for sample dilution.
The leftmost bar in the graph shows biological samples diluted in Assay Diluent to 50% concentration. "undiluted" was defined as 50% biological sample. The subsequent bars represent two-fold serial dilutions of this reference. The mean target concentration was determined to be 97.89 pg/mL in Human heparin plasma.
Dilution Linearity
The concentrations of Human CXCL1 were measured and interpolated from the target standard curves and corrected for sample dilution.
The leftmost bar in the graph shows biological samples diluted in Assay Diluent to 50% concentration. "undiluted" was defined as 50% biological sample. The subsequent bars represent two-fold serial dilutions of this reference. The mean target concentration was determined to be 153.99 pg/mL in Human EDTA plasma.
Dilution Linearity
The concentrations of Human CXCL1 were measured and interpolated from the target standard curves and corrected for sample dilution.
The leftmost bar in the graph shows biological samples diluted in Assay Diluent to 50% concentration. "undiluted" was defined as 50% biological sample. The subsequent bars represent two-fold serial dilutions of this reference. The mean target concentration was determined to be 74.55 pg/mL in Human citrate plasma.
HOOK Effect Threshold
The upper limit of the HOOK effect was established at 100× the highest calibrator concentration (equivalent to a 2-log10 increase). No HOOK effect was observed below this threshold, confirming that samples within this concentration range yield reliable quantitative results without signal depression.
Serum levels in healthy individuals
Duplicate measurements were performed on serum samples obtained from eight individual healthy donors. Data are reported as dilution factor-corrected interpolated. The resultant mean CXCL1 concentration was 116.67 pg/mL, with a distribution spanning 0 to 227.02 pg/mL across the donor cohort.
Intra-Assay Precision (Precision within an assay)
Three samples of known concentration were tested fifteen times on one plate to assess intra-assay precision.
Inter-Assay Precision (Precision between assays)
Three samples of known concentration were tested in separate assays to assess inter-assay precision. Assays were performed with at least three lots of components.
Comparison of Standard Curves from Three Kits
Standard curves from Company A, Company B, and Starter Onestep were compared.
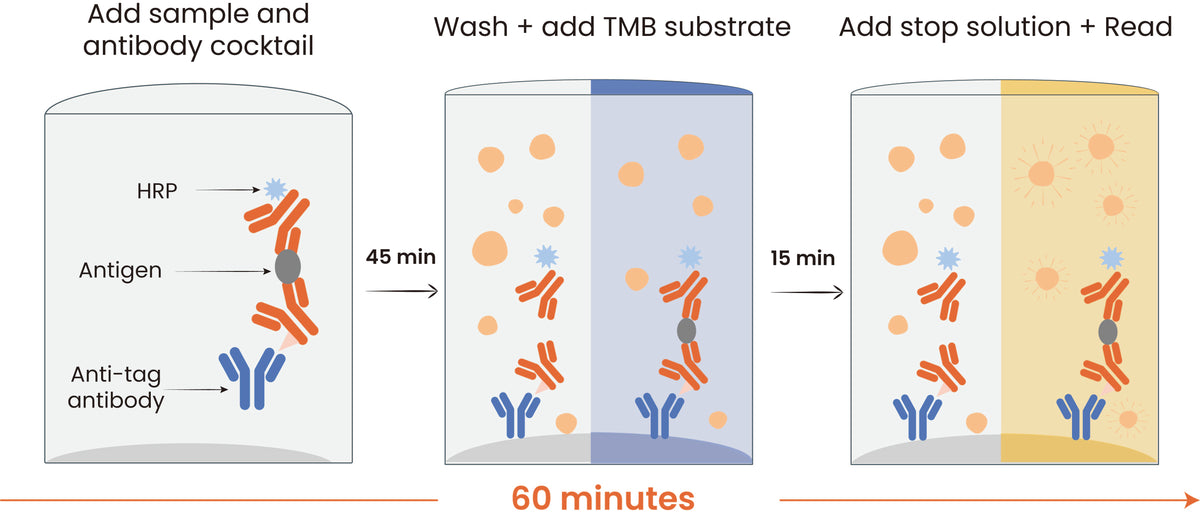
Protocol Diagram