UniOne® TR-FRET Human GSPT1/CRBN PROTAC Binding Kit
UniOne® TR-FRET Human GSPT1/CRBN PROTAC Binding Kit

Product Details
Product Details
Product Specification
| Host | Human |
| Stability & Storage | -80℃ |
Background
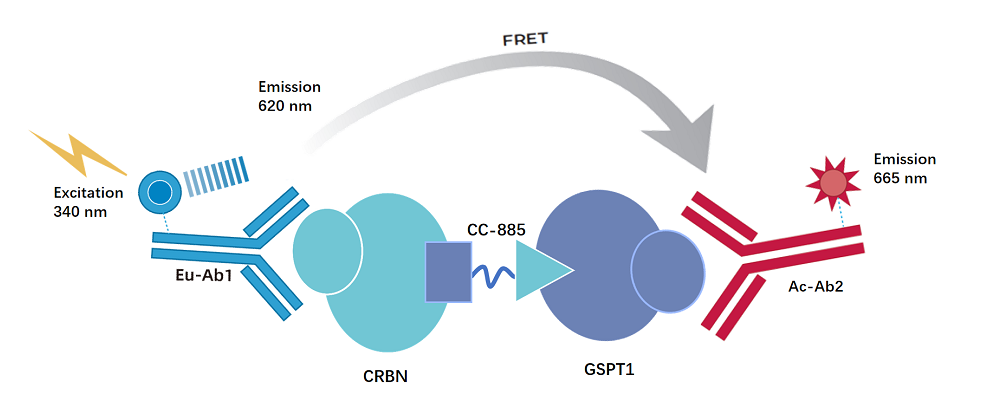
The kit employs homogeneous time-resolved fluorescence technology (TR-FRET) to measure the interaction between the molecular glueCC-885and the compound under test, mediated by theDDB1/CRBNcomplex andGSPT1.This method provides a simple and rapid high-throughput assay for identifying small molecules capable of mediating the interaction between theDDB1/CRBNcomplex andGSPT1.As shown in the figure,
the interaction betweenDDB1/CRBNandGSPT1is detected using anEulabeled anti-Tag1antibody (TR-FRETdonor) and anaccepterlabeled anti-Tag2antibody (TR-FRETacceptor). Because the molecular glueCC-885mediates the interaction betweenDDB1/CRBNandGSPT1,the donor antibody and the acceptor antibody come into close proximity, and excitation of the donor antibody triggers fluorescence resonance energy transfer (FRET) to the acceptor antibody, causing the acceptor antibody to emit fluorescence specifically at665 nm.A signal with a specific wavelength. This particular signal is directly proportional to the extent of interaction betweenCC-885andDDB1/CRBN,GSPT1. This homogeneous assay is easy to perform and requires no washing steps.
Components
Component |
Concentration |
100T |
500T |
2500T |
10000T |
Storage Temperature |
Tag1-DDB1/CRBN protein |
100× |
5μL |
20μL |
100μL |
400μL |
-80℃ |
Tag2-GSPT1 protein |
100× |
5μL |
20μL |
100μL |
400μL |
-80℃ |
CC-885 |
4mMinDMSO |
5μL |
5μL |
25μL |
100μL |
-80℃ |
Anti-Tag1 Eu antibody |
50× |
10μL |
50μL |
250μL |
1000μL |
-80℃ |
Anti-Tag2 Ac antibody |
100× |
5μL |
25μL |
125μL |
500μL |
-80℃ |
Detection buffer |
10× |
400μL |
2mL |
110mL |
40mL |
-80℃ |
Note: After the first thaw, aliquot immediately and store at the recommended temperature. Avoid storing after dilution and repeated freeze-thaw cycles.
Protocol
1,Reagent preparation
1.1Before use, allow all reagents to thaw at room temperature (equilibrate at room temperature for at least 30 minutes). The reaction volume in a 384-well plate is 20.muL (the reagent volumes for the reaction system are shown in the table). Calculate the required volume before preparation and prepare accordingly. The following formulation is for reference only, using 500 reactions as an example.
Table 1.Reagent preparation and usage amounts
Reagent name |
Configuration |
μL per test well |
Detection buffer |
take2mLDetection buffer stock solution,Add to 18 ml ddH₂O.2In O, mix thoroughly to obtain1× Detection buffer. |
- |
Standard substance/Sample to be testedDilution |
Use diluted to1timesofDetection bufferPrepare the samples to be tested and the standard solutions. If the stock solution of the sample is…DMSO, it is recommended to maintain the system.DMSOThe content is consistent and does not exceed the maximum limit.2%.Standard dilutions are shown in the table below. |
2 |
Tag1-DDB1/CRBN protein |
take20 μL Tag1-DDB1/CRBN proteinUndiluted solution,1× Detection bufferDilute to2 mL,Mix well and set aside. |
4 |
Tag2-GSPT1 protein |
take20 μL Tag2-GSPT1 proteinUndiluted solution,Dilute 1× detection buffer to a final volume of 2 mL.Mix well and set aside. |
4 |
AntibodyMix |
takeFiftyμL Anti-Tag1 Eu antibodyConcentrate, add1× Detection buffer 2.45 mL, SufficientMix well;take25 μL Anti-Tag2 Ac antibodyConcentrate, add1× Detection buffer 2.4seventy-fivemL,Mix thoroughly; combine the above two components in a 1:1 ratio to obtain the Antibody Mix. |
10 |
1.2Standard Preparation Table
Please prepare the total amount of standard solutions based on the experimental conditions; the following information is for reference only.
Use diluted to1XPrepare the samples to be tested and the standards using the assay buffer. If the stock solution of the sample is…DMSO, it is recommended to maintain within the system.DMSOConsistent content,(The detection buffer does not containDMSOPlease, based on the dilution of the standard or the sample to be tested, proceed to…1XAdded to the detection bufferDMSO)and not exceeding a maximum of2%.
Table2.Standard Preparation Table
CC-885Final concentration (nM) |
CC-885Preparation concentration (nM) |
Configuration method |
|
1 |
4000.00 |
40000.0 |
1 μL 4 mMMother liquor+99 μL 1× Detection buffer |
2 |
1333.33 |
13333.33 |
30 μL①+60 μL 1× Detection buffer |
3 |
444.44 |
4444.44 |
30 μL②+60 μL 1× Detection buffer |
4 |
148.15 |
1481.48 |
30 μL③+60 μL 1× Detection buffer |
5 |
49.38 |
493.83 |
30 μL④+60 μL 1× Detection buffer |
6 |
16.46 |
164.61 |
30 μL⑤+60 μL 1× Detection buffer |
7 |
5.49 |
54.87 |
30 μL⑥+60 μL 1× Detection buffer |
8 |
1.83 |
18.29 |
30 μL⑥+60 μL 1× Detection buffer |
9 |
0.61 |
6.1 |
30 μL⑥+60 μL 1× Detection buffer |
Blank |
0 |
0 |
60 μL 1× Detection buffer |
2.Sample addition and controls
2.1 Sample to be tested: Add 2 μL of the gradient-diluted sample, 4 μL of Tag1-DDB1/CRBN protein working solution, and 4 μL of Tag2-GSPT1 protein into a 384-well plate in sequence.10μLAntibodyMix.
2.2 Positive control standard curve: Add 2 μL of CC-885 diluted in a gradient, 4 μL of Tag1-DDB1/CRBN protein working solution, 4 μL of Tag2-GSPT1 protein,10μLAntibodyMix.
2.3Negative control well (NC): Replace the sample to be tested with 2 μL of 1× Detection buffer;
2.4 Eu reference well: Add 10 μL of 1× Detection buffer plus10μLAntibodyMix.
Positive control standard curve |
Sample to be tested |
Negative control well (NC) |
Eu reference well |
|
Step one |
2μL Gradient dilutionCC-885 |
2μL Gradient dilute the sample to be tested |
2μL 1× Detection buffer |
10μL 1×Detection buffer +10μL Antibody Mix |
4μL Tag1-DDB1/CRBN protein | ||||
4μL Tag2- GSPT1 protein | ||||
|
Seal the plate,1000rpm, centrifuge1minMix well, incubate at room temperature10min | ||||
Step two |
10μL Antibody Mix |
|||
|
Seal the plate,1000rpm, centrifuge1minMix well, incubate at room temperature120min, read the plate | ||||
3,detection
Detect on a TR-FRET-compatible microplate reader.Excitation light is 320/340nm, detecting emission wavelengths at 620nm and 665nm.Emissionwavelengths.
[Result Calculation]
1)Calculate the signal value(Ratio): The 665nm fluorescence signal is multiplied by 10,000 compared to the 620nm fluorescence signal..
Ratio = (665/620)×10000
2)Calculate based on the signal value.Net signal:
Net signal= (Std-Blank)/Blank × 100
3)Calculate CV (%).:
CV (%) = Standard Deviation / Mean Ratio × 100%
[Data Example]
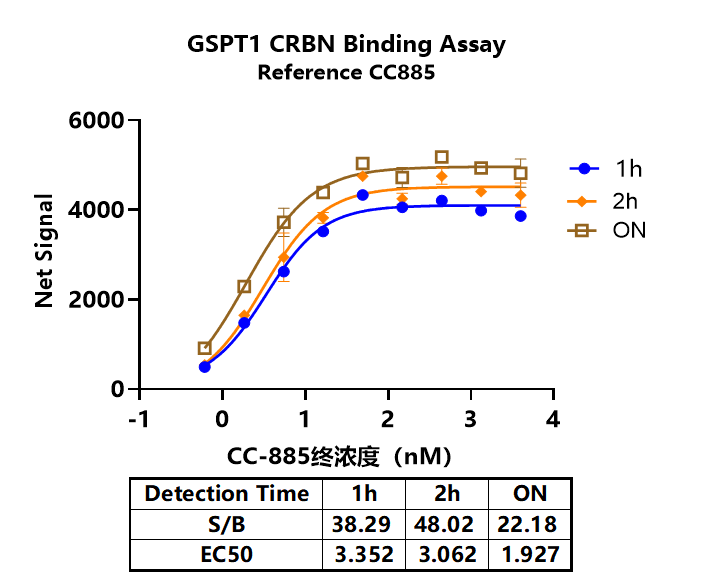
The following data cannot replace the data obtained in experiments; it is only for illustrative purposes, and the results mayvary depending on the plate reader.Instrumentmay vary.
(1) Standard Curve*
The following data cannot replace the data obtained in experiments; it is only for illustrative purposes, and the results may vary depending onTR-FRETcompatible instruments.