Standard curve
Example of Human IL-1β、IL-2、IL-4、IL-5、IL-6、IL-8、IL-10、IL-12p70、IL-13、IL-17A、TNF-α、IFN-γ、IFN-α、GM-CSF、MCP-1/CCL2 standard curve in Assay Diluent .
Human Cytokine 15-Plex Assay (for Luminex)
Human Cytokine 15-Plex Assay (for Luminex)
Price:
Regular price
$5,585 USD
Regular price
Sale price
$5,585 USD
Unit price
per
For shipping services or bulk orders, you may request a quotation.
Secure checkout with

View full details
Product Details
Product Details
Product Specification
| Reactivity | Human |
| Stability & Storage | 12 months from date of receipt / reconstitution, 2 to 8°C as supplied. |
Kit
| Precision | Intra-assay: <10%; Inter-assay: <20% |
| Sample type | Serum; Plasma; Cell culture supernatant |
| Assay type | Sandwich (quantitative) |
| Sensitivity | <1pg/mL |
| Range |
IL-1β:0.15-50000pg/mL; IL-2:0.41-10000pg/mL; IL-4:0.16-4000pg/mL; IL-5:0.68-15000pg/mL; IL-6:0.23-4000pg/mL; IL-8:0.25-30000pg/mL; IL-10:0.78-30000pg/mL; IL-12p70:0.12-30000pg/mL; IL-13:0.35-8000pg/mL; IL-17A:0.27-30000pg/mL; TNF-α:0.76-120000pg/mL; IFN-γ:0.52-15000pg/mL; IFN-α:0.18-15000pg/mL; GM-CSF:0.24-30000pg/mL; MCP-1/CCL2:0.73-4000pg/mL |
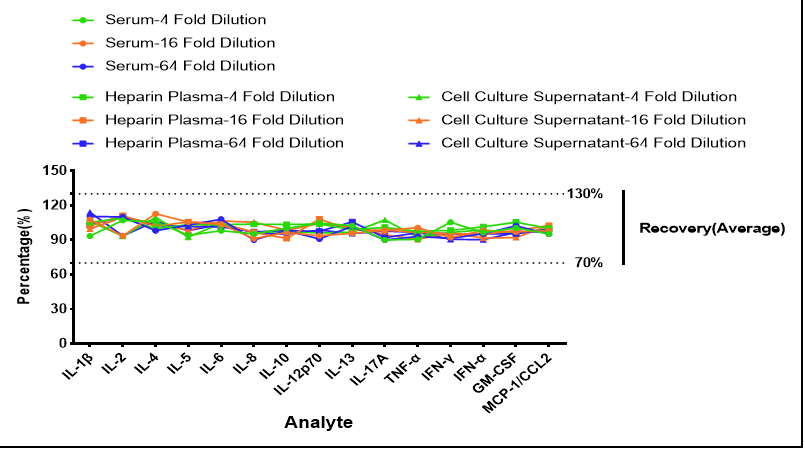
| Recovery | Plasma: 70%-130% Serum: 70%-130% Cell culture supernatant: 70%-130% |
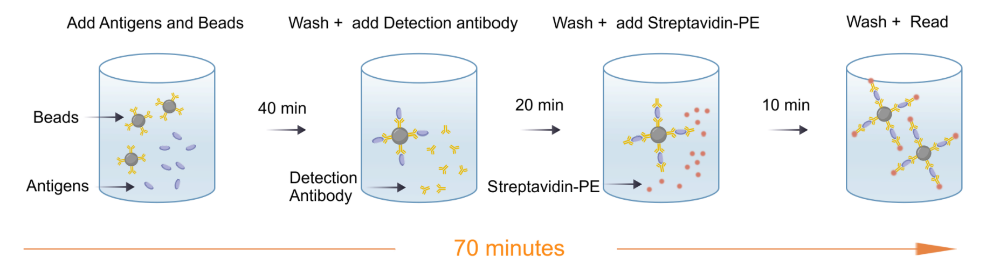
| Assay time | 70 minutes |
| Species reactivity | Human |
Background
The Proinflammatory Panel (human) measures fifteen cytokines that are important in inflammatory responses and immune system regulation as well as many other biological processes. These assays can detect secreted biomarkers in a variety of tissues and body fluids where over- or under-expression may indicate a shift in biological equilibrium. This panel also includes assays for many of the Th1/Th2 pathway biomarkers. The Proinflammatory Panel (human) measures biomarkers that are implicated in a number of disorders, including rheumatoid arthritis, Alzheimer disease, asthma, atherosclerosis, allergies, systemic lupus erythematosus,obesity,cancer,depression, multiple sclerosis,diabetes, psoriasis, and Crohn disease. As a result of their association with such a wide spectrum of disease, these biomarkers are the subjects of drug discovery projects and basic research.
Picture
Picture
Luminex
Quantifiction of Human PBMC
Stimulated sample: Human peripheral blood mononuclear cells (PBMCs) were stimulated with ConA、PHA、lono、LPS for 24h, and the concentration of IL-1β、IL-2、IL-4、IL-5、IL-6、IL-8、IL-10、IL-12p70、IL-13、IL-17A、TNF-α、IFN-γ、IFN-α、GM-CSF、MCP-1/CCL2 in the supernatant were shown in the figure
Unstimulated sample: Human peripheral blood mononuclear cells (PBMCs) were cultured for 24h, and the average concentration of IL-1β、IL-2、IL-4、IL-5、IL-6、IL-8、IL-10、IL-12p70、IL-13、IL-17A、TNF-α、IFN-γ、IFN-α、GM-CSF、MCP-1/CCL2 in the supernatant were shown in the figure.
Spike Linearity
The high-concentration Human IL-1β、IL-2、IL-4、IL-5、IL-6、IL-8、IL-10、IL-12p70、IL-13、IL-17A、TNF-α、IFN-γ、IFN-α、GM-CSF、MCP-1/CCL2 proteins were serially diluted using serum, plasma and Cell Culture Supernatant matrices respectively. Then, the concentration of Human IL-1β、IL-2、IL-4、IL-5、IL-6、IL-8、IL-10、IL-12p70、IL-13、IL-17A、TNF-α、IFN-γ、IFN-α、GM-CSF、MCP-1/CCL2 were determined and interpolated based on the target standard curve, and the sample dilution was corrected.
Spike Recovery
Within the detection range, the cytokine proteins were added to serum,plasma and Cell Culture Supernatant ,The matrices used in these experiments were diluted 2-fold with the assay buffer before the addition of the cytokine proteins. The results were compared with those of samples that had the same concentration of cytokines added in the assay buffer.
Normal Samples
Normal human serum, EDTA plasma from a commercial source were diluted 2-fold and tested. Results for each sample set are displayed below. Concentrations are corrected for sample dilution. Median and range are calculated from samples with concentrations at or above the LLOD.
HOOK
Protocol Diagram