UniOne® TR-FRET Human PD1/PD-L1 Binding Kit
UniOne® TR-FRET Human PD1/PD-L1 Binding Kit

Product Details
Product Details
Product Specification
| Host | Human |
| Stability & Storage | -80℃ |
Background
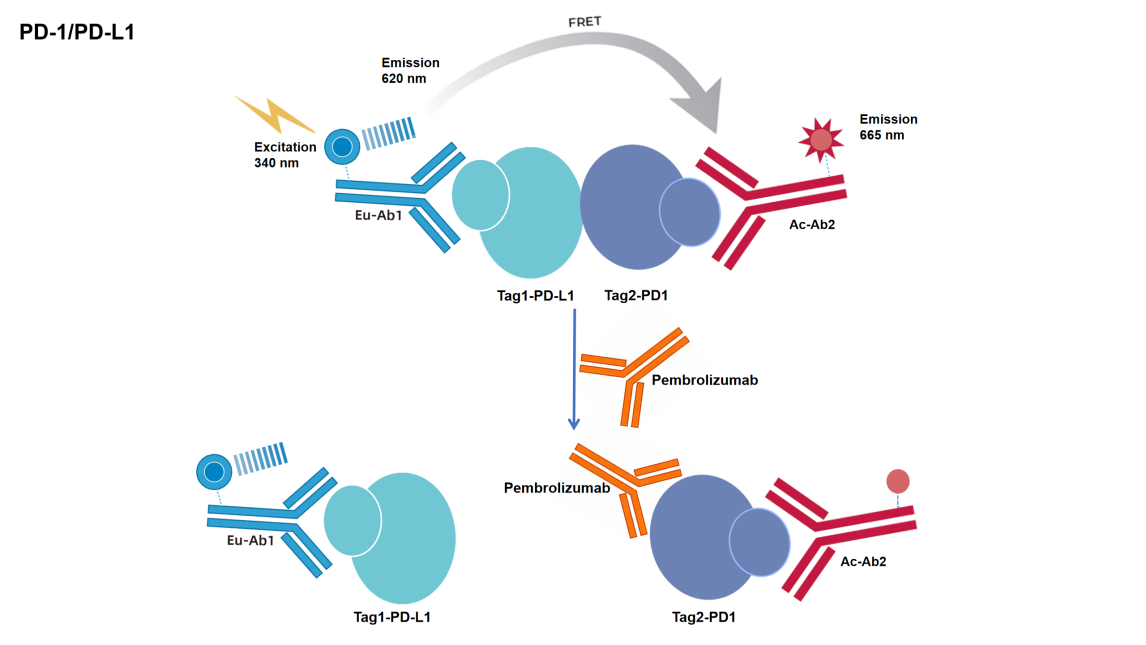
The assay kit utilizes homogeneous time-resolved fluorescence (TR-FRET) technology to measure the interaction between PD1 and PD-L1. This method enables simple, rapid, and high-throughput screening of inhibitors and antibody blockers.
As shown in the figure, the interaction between PD1 and PD-L1 is detected using an Eu-labeled anti-Tag1 antibody (TR-FRET donor) and an Ac-labeled anti-Tag2 antibody (TR-FRET acceptor). The binding of PD1 and PD-L1 brings the donor and acceptor antibodies into proximity, allowing the excitation of the donor antibody to trigger fluorescence resonance energy transfer (FRET) to the acceptor antibody, resulting in a specific emission signal at 665 nm. Pembrolizumab, as a positive control, blocks the interaction between PD1 and PD-L1, preventing FRET signal generation. The stronger the blocking effect of the screened drug on the PD1/PD-L1 interaction, the lower the signal. The specific signal is proportional to the extent of the PD1/PD-L1 interaction. This homogeneous assay is simple to perform and requires no washing steps.
Components
Component |
Concentration |
100T |
500T |
2500T |
10000T |
Storage Temperature |
Pembrolizumab |
5μM |
5μL |
10μL |
50μL |
200μL |
-80℃ |
Tag1-PD-L1 protein |
100× |
5μL |
20μL |
100μL |
400μL |
-80℃ |
Tag2- PD1 protein |
100× |
5μL |
20μL |
100μL |
400μL |
-80℃ |
Anti-Tag1 Eu antibody |
50× |
10μL |
50μL |
250μL |
1000μL |
-80℃ |
Anti-Tag2 Ac antibody |
12.5× |
40μL |
200μL |
1000μL |
4000μL |
-80℃ |
Detection buffer |
10× |
400μL |
2mL |
10mL |
40mL |
-80℃ |
Note: Aliquot immediately upon first thaw and store at the recommended temperature. Avoid storage after dilution and repeated freeze-thaw cycles.
Protocol
1. Reagent Preparation
1.1 Thaw all reagents to room temperature before use (equilibrate at room temperature for at least 30 min). The reaction volume for the 384-well shallow plate is 20 μL (reagent volumes for the reaction system are shown in the table). Calculate the required volume for the experiment before preparation and prepare as needed; the following preparation is for reference only, using 500 reactions as an example.
Table 1. Reagent Preparation
Reagent Name |
Preparation |
Volume per Assay Well (μL) |
Tag1-PD-L1 protein |
Take 20 μL of Tag1-PD-L1 protein stock solution and dilute to 2 mL with 1× Detection buffer,mix well and set aside. |
4 |
Tag2- PD1 protein |
Take 20 μL of Tag2-PD1 protein stock solution and dilute to 2 mL with 1× Detection buffer,mix well and set aside. |
4 |
Mix |
Take 50 μL of Anti-Tag1 Eu antibody stock solution and add 2.45 mL of 1× Detection buffer, mix well and set aside; Take 200 μL of Anti-Tag2 Ac antibody stock solution and add 2.3 mL of 1× Detection buffer, mix well and set aside; After diluting Anti-Tag1 Eu antibody and Anti-Tag2 Ac antibody separately, mix them at a 1:1 ratiomix well and set aside. |
10 |
Pembrolizumab |
According to the reaction system, dilute the compound with 1× Detection buffer to 10 times the final concentration in the system to serve as a positive control. For example, if the final concentration in the system is 10 nM, the dilution concentration should be 100 nM. Simultaneously, use DMSO diluted with 1× Detection buffer as the negative control well. |
2 |
1.2 Gradient Dilution of Test Samples
Using Pembrolizumab as an example, the diluent is 1× Detection buffer. To minimize the impact of matrix effect interference, it is recommended to dilute with a solution having the same matrix as the test sample; adjust the test sample according to its actual concentration.
Table 2. Gradient Dilution of Positive Drug Pembrolizumab (Adjust according to actual conditions)
Pembrolizumab Final Concentration (nM) |
Pembrolizumab Preparation Concentration (nM) |
Preparation Method |
|
① |
10 |
100 |
1μL 5μM Pembrolizumab+49μL 1× Detection buffer |
② |
5 |
50 |
25μL ① +25μL 1× Detection buffer |
③ |
2.5 |
25 |
25μL ② +25μL 1× Detection buffer |
④ |
1.25 |
12.5 |
25μL ③ +25μL 1× Detection buffer |
⑤ |
0.63 |
6.3 |
25μL ④ +25μL 1× Detection buffer |
⑥ |
0.31 |
3.1 |
25μL ⑤ +25μL 1× Detection buffer |
⑦ |
0.16 |
1.6 |
25μL ⑥ +25μL 1× Detection buffer |
⑧ |
0.08 |
0.8 |
25μL ⑦ +25μL 1× Detection buffer |
⑨ |
0.04 |
0.4 |
25μL ⑧ +25μL 1× Detection buffer |
⑩ |
0.02 |
0.2 |
25μL ⑩ +25μL 1× Detection buffer |
Blank |
0 |
0 |
25μL 1× Detection buffer |
Eu+Ac |
2. Sample Addition and Controls
2.1 Sample addition order for assay wells: Add 2 μL of test sample, 4 μL of Tag2-PD1 protein working solution, 4 μL of Tag1-PD-L1 protein working solution, and 10 μL of mixed Mix sequentially into the 384-well shallow plate;
2.2 Maximum Control: 2 μL of 1× Detection buffer, 4 μL of Tag2-PD1 protein working solution, 4 μL of Tag1-PD-L1 protein working solution, and 10 μL of mixed Mix;
2.3 Quality Control Well (NC): 10 μL of 1× Detection buffer plus 10 μL of Mix.
Maximum Control |
Sample |
NC |
|
Step 1 |
2μL 1× Detection Buffer (containing DMSO) |
2μL Gradient diluted test sample |
10uL 1× Detection Buffer |
4μL Tag2-PD1 protein working solution | |||
Incubate for 10 min | |||
|
Step 2 |
4μL Tag1-PD-L1 protein working solution |
||
10μL Mix | |||
Step 3 |
Seal with plate sealer, incubate at room temperature for 2 h |
||
3. Detection
Detect on a microplate reader compatible with TR-FRET. Excitation wavelength is 320/340 nm, and emission wavelengths are 620 nm and 665 nm.
[Result Calculation]
1) Calculate the signal value (Ratio): Divide the 665 nm fluorescence signal by the 620 nm fluorescence signal, then multiply by 10,000.
Ratio = (665/620) ×10000
2) Calculate Net signal based on the signal value:
Net signal = (Std-NC)/NC×100
3) Calculate CV (%):
CV (%) = Standard Deviation/Mean Ratio × 100%
[Data Example]
The following data cannot replace the data obtained in experiments and is only for illustration; results may vary depending on the plate reader.

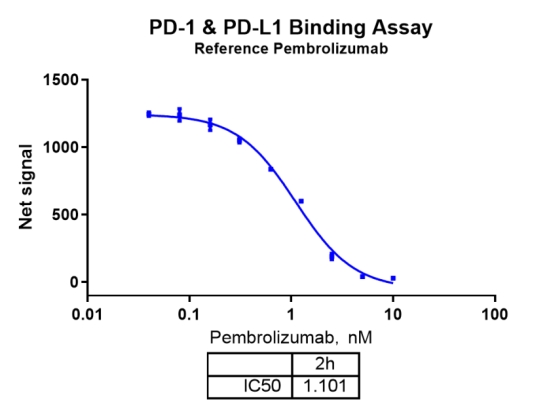
Note: Recommended microplate (384-well plate, white, shallow well)