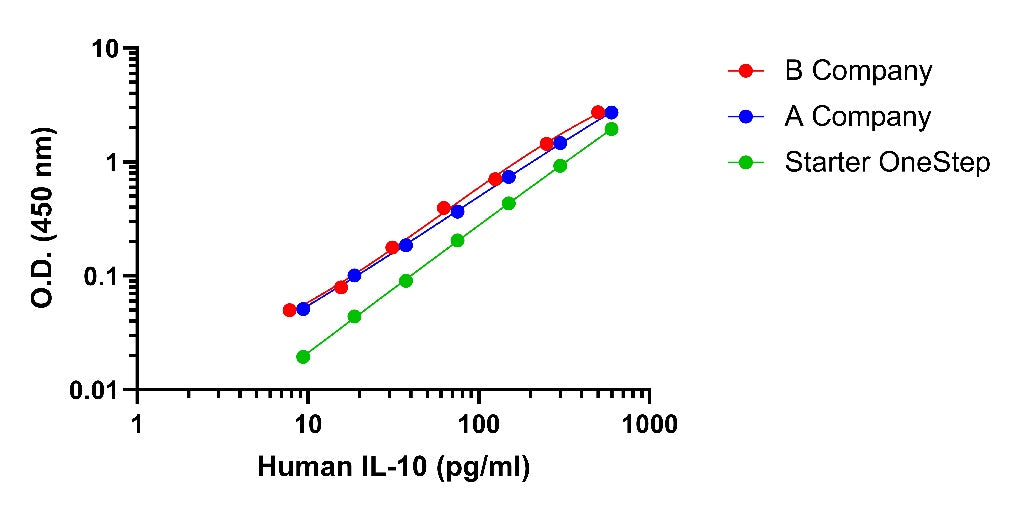
Standard curve
Example of NIBSC (93/722) standard curve in Assay Diluent #12.
Human IL-10 OneStep ELISA Kit
Human IL-10 OneStep ELISA Kit
Price:
Regular price
$120 USD
Regular price
Sale price
$120 USD
Unit price
per
For shipping services or bulk orders, you may request a quotation.
Secure checkout with

View full details
Product Details
Product Details
Product Specification
| Antigen | IL-10 |
| Immunogen | Recombinant Protein |
| Antibody Type | Recombinant mAb |
| Reactivity | Hu |
| Purification | Protein A |
| Stability & Storage | 2 to 8 °C as supplied. |
Kit
| Precision | Intra-assay: 2.9%; Inter-assay:5.6% |
| Sample type | Cell culture supernatant, Serum, Plasma |
| Assay type | Sandwich (quantitative) |
| Sensitivity | 4.013pg/ml |
| Range | 9.38 pg/mL – 600 pg/mL |
| Recovery | Cell culture supernatant: 101% Serum: 81% Plasma:85% |
| Assay time | 60 minutes |
| Species reactivity | Human |
| NIBSC convert | The dose response curve of the International Standard (93/722) parallels the OneStep standard curve. To convert sample values obtained with the kit to approximate NIBSC (93/722) units, use the following equation: NIBSC (93/722) approximate value (IU/mL) = 0.005 x OneStep Human IL-10 value (pg/mL). |
Background
Interleukin 10 (IL-10), also known as human cytokine synthesis inhibitory factor (CSIF), is an anti-inflammatory cytokine. In humans, IL-10 is primarily produced by monocytes and, to a lesser extent, lymphocytes, namely type-II T helper cells (TH2), mast cells, CD4+CD25+Foxp3+ regulatory T cells, and in a certain subset of activated T cells and B cells. IL-10 can be produced by monocytes upon PD-1 triggering in these cells. IL-10 is a cytokine with multiple, pleiotropic, effects in immunoregulation and inflammation. It downregulates the expression of Th1 cytokines, MHC class II antigens, and co-stimulatory molecules on macrophages. It also enhances B cell survival, proliferation, and antibody production. IL-10 can block NF-κB activity, and is involved in the regulation of the JAK-STAT signaling pathway.
Picture
Picture
ELISA
Standard curve
Example of human IL-10 standard curve in Assay Diluent #12.
Linearity
The concentrations of Human IL-10 were measured and interpolated from the target standard curves and corrected for sample dilution.
The sample is undiluted samples are as follows: human PBMC cells stimulated with 10ug/ml PHA for 2days (25%). The interpolated dilution factor corrected values are plotted. The mean target concentration was determined to be 4895 pg/mL in stimulated human PBMC supernatant.
Linearity
The sample is undiluted samples are as follows: human PBMC cells culture for 2days (100%). The interpolated dilution factor corrected values are plotted. The mean target concentration was determined to be 58.81pg/mL in unstimulated human PBMC supernatant.
To assess the linearity of the assay, three samples were spiked with high concentrations of Human IL-10 in various matrices and diluted with the appropriate Calibrator Diluent to produce samples with values within the dynamic range of the assay.
Leading Competitor comparison
Protocol Diagram