Standard curve
Example of CXCL9/MIG standard curve in Assay Diluent .
Mouse CXCL9/MIG Single Plex Kit (Flow Cytometry Bead Assay)
Mouse CXCL9/MIG Single Plex Kit (Flow Cytometry Bead Assay)
Price:
Regular price
$500 USD
Regular price
Sale price
$500 USD
Unit price
per
For shipping services or bulk orders, you may request a quotation.
Secure checkout with

View full details
Product Details
Product Details
Product Specification
| Antigen | CXCL9/MIG |
| Reactivity | Mouse |
| Stability & Storage | 12 months from date of receipt / reconstitution, 2 to 8°C as supplied. |
Kit
| Sample type | Serum; Plasma; Cell culture supernatant |
| Assay type | Sandwich (quantitative) |
| Sensitivity | 40 pg/mL |
| Range | 50 pg/mL-250000 pg/mL |
| Recovery | Cell culture supernatant: 106% |
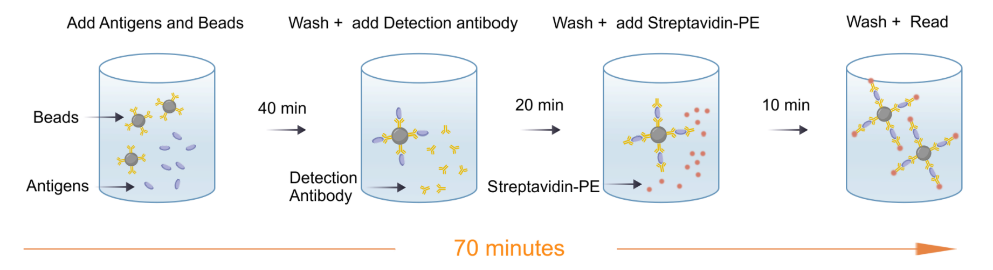
| Assay time | 70 minutes |
| Species reactivity | Mouse |
Background
Mouse CXCL9/MIG (monokine induced by interferon-gamma) is a key chemokine secreted by IFN-γstimulated activated monocytes, macrophages, and endothelial cells, and belongs to the ELRnegative CXC chemokine subfamily. As a core biomarker of Th1type immune responses, CXCL9 specifically binds to its receptor CXCR3 to efficiently recruit CD4+ Th1 cells, CD8+ cytotoxic T cells, and NK cells to sites of inflammation or tumors, while also participating in immune balance regulation by antagonizing Th2 responses. In addition, its ELRnegative nature confers a unique ability to inhibit vascular endothelial cell proliferation and angiogenesis, which gives CXCL9 a dual role in the tumor microenvironment—it can recruit cytotoxic immune cells to mediate antitumor effects (via CXCR3B), yet it may also promote tumor migration through specific signaling pathways (via CXCR3A). Based on these functions, quantitative detection of CXCL9 holds significant application value in the evaluation of cancer immunotherapies, early warning of organ transplant rejection, mechanistic studies of metabolic inflammationassociated diseases such as MAFLD/MASH, and monitoring of infectious immunity. Thus, CXCL9 serves as a critical biomarker reflecting cellular immune activity and the inflammatory status of the microenvironment.
Picture
Picture
CBA
Quantifiction of Mouse spleen cells
Stimulated sample: Mouse spleen cells were stimulated with 10 μg/mL ConA for 24h, and the average concentration of CXCL9/MIG in the supernatant was measured to be 4192.7 pg/mL.
Unstimulated sample: Mouse spleen cells were cultured for 24h, and the average concentration of CXCL9/MIG in the supernatant was measured to be 7.94 pg/mL.
Linearity
After serial dilution of C57BL/6 mouse serum, the concentrations of mouse CXCL9/MIG were calculated from standard curves and then corrected for the dilution factor.
Linearity
After serial dilution of C57BL/6 mouse plasma, the concentrations of mouse CXCL9/MIG were calculated from standard curves and then corrected for the dilution factor.
Linearity
After serial dilution of ConA stimulates the supernatant sample of mouse spleen cells, the concentrations of mouse CXCL9/MIG were calculated from standard curves and then corrected for the dilution factor.
Linearity
After serial dilution of BALB/c mouse serum, the concentrations of mouse CXCL9/MIG were calculated from standard curves and then corrected for the dilution factor.
Recovery
Within the detection range, the combined cytokine proteins were added to different matrices at high,medium and low concentrations.
The matrices used in these experiments were diluted 2-fold with the assay buffer before the addition of the cytokine proteins.
The results were compared with those of samples that had the same concentration of cytokines added in the assay buffer.
Protocol Diagram