

Standard Curve
Example of Human IFN-γ standard curve in Assay Diluent AE5. Plotted are the background-subtracted data.
This standard curve is provided for demonstration only.
Human IFN-γ OneStep ELISA Kit
Human IFN-γ OneStep ELISA Kit
Price:
Regular price
$120 USD
Regular price
Sale price
$120 USD
Unit price
per
For shipping services or bulk orders, you may request a quotation.
Secure checkout with

View full details
Product Details
Product Details
Product Specification
| Antigen | IFN-γ |
| Immunogen | Recombinant Protein |
| Antibody Type | Recombinant mAb |
| Reactivity | Hu |
| Purification | Protein A |
| Stability & Storage | 12 months from date of receipt / reconstitution, 2 to 8°C as supplied. |
Kit
| Precision | Intra-assay: 2.7%; Inter-assay: 3.5% |
| Sample type | Serum; Plasma; Cell Culture Supernatant |
| Assay type | Sandwich (quantitative) |
| Sensitivity | 0.6 pg/mL |
| Range | 3.4 pg/mL – 217.4 pg/mL |
| Recovery | Serum: 116% EDTA Plasma:84% Citrate Plasma:85% Cell Culture Supernatant: 86% |
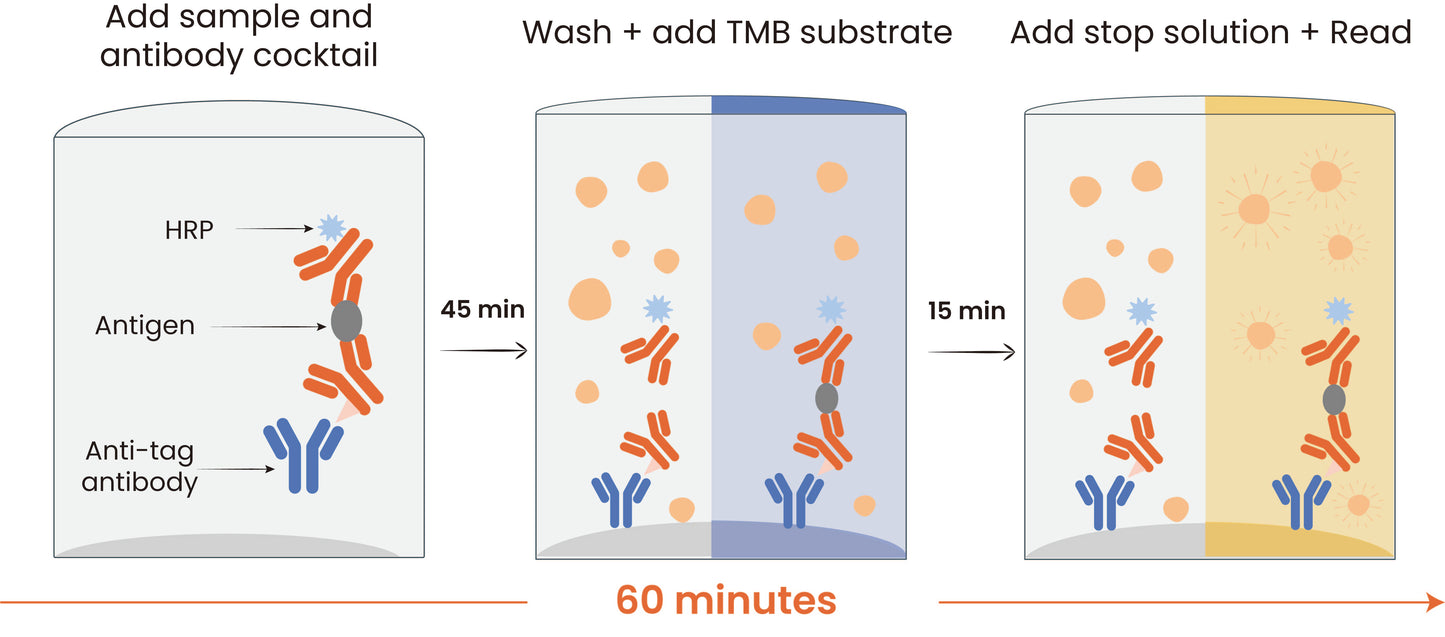
| Assay time | 60 minutes |
| Species reactivity | Hu |
| NIBSC convert | The dose response curve of the International Standard (87/586) parallels the OneStep standard curve. To convert sample values obtained with the kit to approximate NIBSC (87/586) units, use the following equation: NIBSC (87/586) approximate value (IU/mL) = 0.02 x OneStep Human IFNγ value (pg/mL). |
Background
Interferon gamma (IFN-γ) is a cytokine critical to both innate and adaptive immunity, and functions as the primary activator of macrophages, in addition to stimulating natural killer cells and neutrophils. A non-IgE-mediated anaphylactic reaction and severe bronchospasm have been reported once after the first injection of interferon gamma. IFN-γ activates cells via a different receptor than IFN-α and IFN-β, which accounts for the different physiological properties of the proteins. Production of IFN-γ is largely restricted to activated CD4+ TH1 T cells, CD8+ T cells, and natural killer cells. One of the most important consequences of IFN-γ secretion is the activation of macrophages. In addition, IFN-γ plays a central role in inflammatory responses by activating endothelial cells, promoting TH1 cell development and cellular immune responses, and up-regulation of major histocompatability complex protein expression on antigen-presenting cells.
Picture
Picture
ELISA
Standard curve
Example of NIBSC (87/586) standard curve in Assay Diluent A1. Human IFN-γ standard were calibrated by NIBSC (87/586) with a calibration factor (CF) of 1.0. Human IFN-γ standard concentration = NIBSC (87/586)/CF
Spike Recovery
The recovery of Human IFN-γ was evaluated in activated samples spiked with concentrations spanning the entire assay range.
Dilution Linearity
The concentration of human IFN-γ was measured and interpolated using the target standard curve, and the influence of sample dilution was corrected.
The leftmost bar in the figure represents the biological sample diluted to a 1% concentration using the detection diluent. "Un-diluted" is defined as a 1% biological sample. The subsequent bars represent the two-fold serial dilutions of this reference substance. In the culture supernatant of human peripheral blood mononuclear cells stimulated with 10 ug/mL PHA for 5 days, the average target concentration determined was 19.84 ng/mL.
The concentration of human IFN-γ was measured and interpolated using the target standard curve, and the influence of sample dilution was corrected.The leftmost bar in the graph represents neat biological samples. "Undiluted" was defined as the neat biological sample(100%). After culturing human peripheral blood mononuclear cells without stimulation with 10 ug/mL PHA for 5 days, the average target concentration measured in the culture supernatant was 174.49 g/mL.
Spike-and-dilution Linearity
To evaluate assay linearity, three samples were spiked with high levels of Human IFN-γ in different matrices and serially diluted with the corresponding Calibrator Diluent to fall within the assay's dynamic range.
Intra-Assay Precision (Precision within an assay)
Three samples of known concentration were tested fifteen times on one plate to assess intra-assay precision.
Inter-Assay Precision (Precision between assays).
Three samples of known concentration were tested in separate assays to assess inter-assay precision. Assays were performed with at least three lots of components.
Determination of Minimum Detectable Dose (MDD)
The MDD was determined using three independent lots of assay components. For each lot, 19 replicate measurements of the diluent (zero calibrator) were performed. The mean (AVERAGE) and standard deviation (STDEV) of the 19 replicates were calculated. The MDD for each lot was then calculated according to the following formula:
MDD = 2 × STDEV + AVERAGE
HOOK Effect Threshold
The upper limit of the HOOK effect was established at 16× the highest calibrator concentration (equivalent to a 2-log10 increase). No HOOK effect was observed below this threshold, confirming that samples within this concentration range yield reliable quantitative results without signal depression.
Leading Competitor comparison
Protocol Diagram