

Mouse TNF-α Kit (HICA)
Mouse TNF-α Kit (HICA)

Product Details
Product Details
Product Specification
| Stability & Storage | Store at 2~8°C protected from light for 18 months; the reconstituted standard can be aliquoted and stored at -20°C, avoiding repeated freeze-thaw cycles. |
Background
Test Principle:
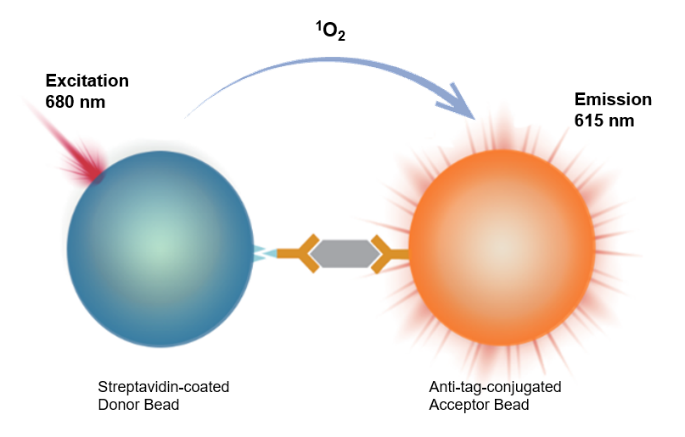
This kit employs a homogeneous immuno chemiluminescence assay (HICA) for the detection of cytokine concentrations. The operation is simple and requires no washing steps.
The detection system consists of two types of microspheres: acceptor microspheres conjugated with antibody 1 targeting the protein of interest, and donor microspheres conjugated with streptavidin, along with biotin-labeled antibody 2. During the reaction, the target protein binds with the antibodies and microspheres to form an immune complex, bringing the two microspheres into close proximity. When the distance between the donor and acceptor microspheres is less than 200 nm, singlet oxygen generated upon light excitation can transfer to the acceptor microsphere, triggering chemiluminescence. Conversely, if the target protein is absent, the distance between the microspheres is too large, and no signal is produced.
By measuring the intensity of the chemiluminescent signal, quantitative analysis of the target protein can be achieved. This method is characterized by its simplicity, rapid reaction, and high sensitivity.
Components
Name |
Specification |
Component Specification |
Detection ReagentR1 |
500T |
2 mL/vial ×1 |
2000T |
8 mL/vial ×1 |
|
10000T |
40 mL/vial ×1 |
|
Detection ReagentR2 |
500T |
2 mL/vial ×1 |
2000T |
8 mL/vial ×1 |
|
10000T |
40 mL/vial ×1 |
|
Detection ReagentR3 |
500T |
5 mL/vial ×1 |
2000T |
20 mL/vial ×1 |
|
10000T |
100 mL/vial ×1 |
|
Standard |
500T |
0.015μglyophilized powder ×1 |
2000T |
0.015μglyophilized powder ×2 |
|
10000T |
0.015μglyophilized powder ×5 |
|
StandardBuffer |
500T |
6 mL/vial ×1 |
2000T |
12 mL/vial ×1 |
|
10000T |
30 mL/vial ×1 |
Note: Recommended plates are microplates (384or96-well plates, white, shallow well)
Protocol
I. Sample Requirements
1. To remove impurities from the sample, centrifuge the sample prior to detection (1000 ×g, 10 minutes).
2. When detecting target proteins in serum samples, standards should be diluted with negative serum having a background value below the lower limit of detection, and a standard curve should be established based on this to calculate the actual concentration.
3. If the measured concentration of a sample exceeds the highest value of the standard curve, appropriately dilute and retest to ensure the result falls within the valid measurement range.
II. Detection Workflow
2.1 Standard Gradient Sample Preparation Reconstitute the lyophilized standard with 50μL of deionized water, then dilute with standard buffer. The recommended dilution scheme is shown in the table below:
Gradient |
Concentration (pg/mL) |
Standard(μL) |
Diluent (μL) |
C12 |
30000 |
20μLCalibrator |
180 |
C11 |
10000 |
60μL C12 |
140 |
C10 |
3000 |
60μL C11 |
120 |
C9 |
1000 |
60μL C10 |
140 |
C8 |
300 |
60μL C9 |
120 |
C7 |
100 |
60μL C8 |
140 |
C6 |
30 |
60μL C7 |
120 |
C5 |
10 |
60μL C6 |
140 |
C4 |
3 |
60μL C5 |
120 |
C3 |
1 |
60μL C4 |
140 |
C2 |
0.3 |
60μL C3 |
120 |
C1 |
0 |
— |
120 |
2.2 Detection Workflow:
Detection Workflow |
Detection Workflow1 (37°C Rapid Detection) |
Detection Workflow2 (Room Temperature Detection) |
Step 1: |
Take 3.5µL of sample and add 7.5µL of pre-mixed R1+R2* |
Take 3.5µL of sample and add 7.5µL of pre-mixed R1+R2* |
Incubation |
Shake/mix at 400rpm for 1min, incubate at 37°C for 15 minutes |
Shake/mix at 400rpm for 1min, incubate at room temperature for 60 minutes |
Step 2: |
Add 9µL of R3, protect from light/green light |
Add 9µL of R3, protect from light/green light |
Incubation |
Shake/mix at 400rpm for 1min, incubate at 37°C for 10 minutes, protect from light/green light |
Shake/mix at 400rpm for 1min, incubate at room temperature for 30 minutes, protect from light/green light |
Reading |
Read on instrument, protect from light/green light |
Read on instrument, protect from light/green light |
* Note: Prior to testing, pre-mix R1 and R2 at a volume ratio of 1:1, and use the mixture within 1 hour after mixing.
* If testing RPMI samples, you may additionally add RPMI enhancer solution (Catalog No.: UA086145). Pre-mix 50 μL of R3 with 100 μL of RPMI enhancer solution before adding, which significantly improves reagent performance.
III.Performance Testing
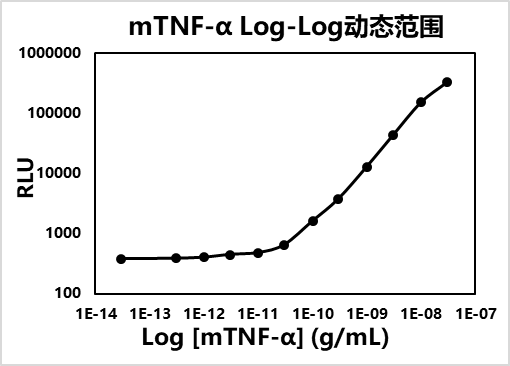
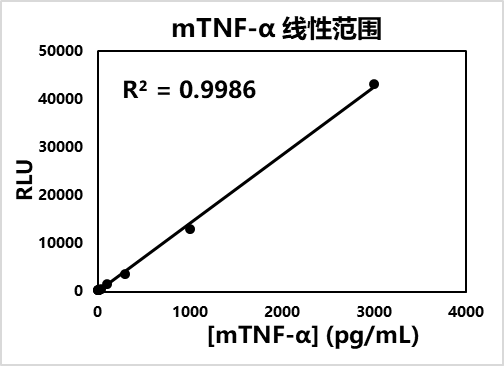
3.1 Example of Complete Standard Curve:
3.2 Validation of Performance Parameters:
LOD:Detect standard C1 repeatedly 20 times, calculate the mean signal and SD. Calculate the concentration corresponding to mean signal +2×SD using the standard curve, which defines the Limit of Detection (LOD).
Detection Workflow |
Matrix |
LOD (pg/mL) |
Quantification Range (pg/mL) |
Dynamic Range (pg/mL) |
Detection Workflow 1 |
Buffer |
2.50 |
2.5~3000 |
0~30000 |
DMEM |
6.08 |
6.1~3000 |
||
RPMI |
11.24 |
11.2~3000 |
||
MouseSerum |
8.00 | 8~3000 |
||
Detection Workflow2 |
Buffer |
3.90 |
3.9~3000 |
Precision (Precision):
Intra-assay Precision: On the same microplate within a single experiment, each of the known low, medium, and high concentration samples is tested repeatedly 10 times to evaluate intra-assay precision. Both standards and samples are tested using different workflows. The coefficient of variation (%CV) for all concentration samples is below 10%, indicating good reproducibility within the same batch.
Detection Workflow |
Matrix |
Precision |
|
Low Concentration |
High Concentration |
||
Detection Workflow 1 |
Buffer |
4.9% |
2.1% |
DMEM |
4.2% |
2.2% |
|
RPMI |
6.1% |
2.0% |
|
Mouse Serum |
6.2% |
2.2% |
|
Detection Workflow2 |
Buffer |
7.4% |
2.2% |
Inter-assay Precision: Test known low, medium, and high concentration samples across 5 independent experiments. Standards and samples are both tested using Detection Workflow 1 with 5 replicates. All concentration samples show low coefficients of variation (%CV <10%), indicating good reproducibility across different batches.
Detection Workflow |
Matrix |
Inter-assayPrecision |
|
Low Concentration |
High Concentration |
||
Detection Workflow 1 |
Buffer |
5.4% |
3.3% |
Accuracy (Recovery):
Mix high and low concentration QC samples at a 1:9 ratio and test their recovery rates. All results fall within 80%-120%, indicating good accuracy of this method.
Detection Workflow |
Matrix |
Recovery |
Detection Workflow 1 |
Buffer |
91.3% |
DMEM |
103.0% |
|
RPMI |
96.0% |
|
MouseSerum |
104.0% |
|
Detection Workflow2 |
Buffer |
86.5% |
Specificity: Dilute the following proteins to 0.1μg/mL using standard buffer and test for cross-reactivity.
Detection Workflow |
Analyte |
Cross-reactivity Rate |
Detection Workflow 1 |
human IFN-γ |
0.00% |
Human TNF-β |
0.00% |
|
human TNF-α |
0.00% |
|
rat TNF-α |
35.09% |
|
Bovine TNF-α |
0.00% |
•Traceability: Tested against reference material NIBSC 88/532, where 1IU/mL≈3pg/mL.
Guidelines
Reagent R3 must be protected from light. Sample addition and incubation should be performed under green light (<100 LUX).
Recalibration is required for each test, with at least duplicate wells for each standard concentration point. Use a four-parameter (weighted 1/Y²) fitting method for calculation.
Temperature and time must be strictly controlled during incubation. Microplates should be covered with a film, and a microplate reader with ALPHA function is recommended.
The dilution matrix for calibrators should match the sample matrix. Reconstituted calibrators must be used within 2 hours.
Components from different reagent kit lots must not be mixed.